
- Title
-
Multibow: Digital Spectral Barcodes for Cell Tracing
- Authors
- Xiong, F., Obholzer, N.D., Noche, R.R., Megason, S.G.
- Source
- Full text @ PLoS One
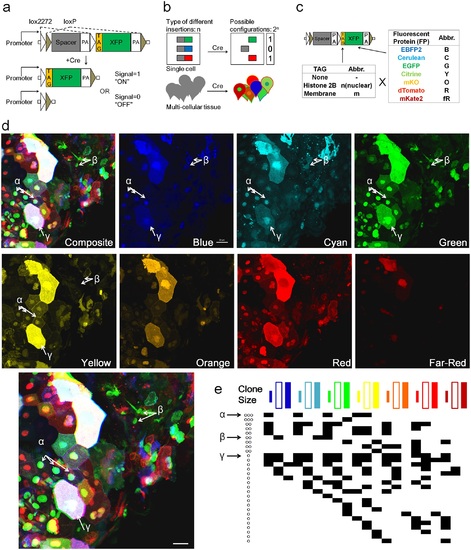
Design and test of Multibow in zebrafish. a. Modified “Brainbow [1]” cassette that allows a binary ON/OFF switch. b. Multibow Strategy. Each cell harbors multiple different ON/OFF cassettes to generate random color “digital” barcodes upon Cre-mediated recombination. c. Table of Multibow Tags and Fluorescent Proteins (FPs). d. Diversity of color codes. Image is a densely labeled region along the trunk of a 40hpf hsp70:cerulean-cre embryo injected with all 21 Multibow constructs and heat-shocked at 10hpf for 1 hour. The color and tag diversity generates barcodes for cell clones that appear random and diverse. Intensity differences further help distinguish cells from neighbors visually. The Composite image is made from the green, yellow (turned to blue) and red panels. 3 different clones are highlighted by α, β, γ and corresponding arrows. Scale bar: 10µm. See also S3 Table. e. Partial table of clones of different color codes found in d.. The colored square labels of the top row indicate nuclear, membrane and cytoplasmic, respectively. A black square in the table indicates this clone being positive for the corresponding color. Distinct "barcodes" form for different clones. The α, β, γ clones are indicated by arrows. The number of annotated cells labels (~30) represents a large fraction of cells found in the image in d, which contains ~50 cells. The fact that most of these cells have a color code distinct from any other cell (except clones that have the same color) show that Multibow label is highly random. |
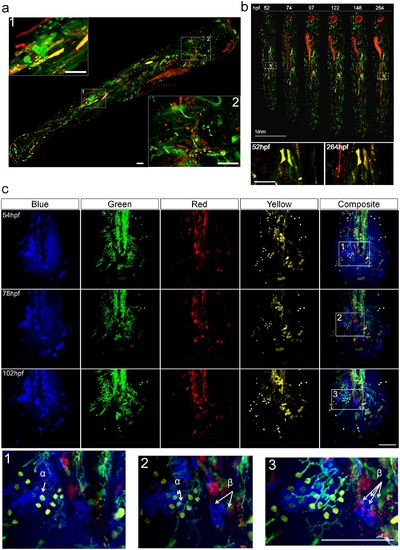
Spatial temporal coverage and stability of Multibow labeling. a. Spatial and cell type coverage of Multibow. The embryo was injected with 6 Multibow colors (mR/mG/nR/nG/R/G) at single cell stage and heat-shocked at 1 day-post-fertilization (dpf) for 2 hours. The whole 4dpf larva was imaged in 2 channels (G/R). Positive cells can be seen distributed from head to tail throughout the larva, indicating high spatial coverage. In inserts 1 and 2, distinctly shaped skin, muscle, mesenchymal and neural cells can be observed by cytoplasmic or membrane Multibow labeling. Scale bars: 100µm. b. Temporal stability of labeling. The embryo was injected with 6 Multibow colors (mR/mG/nR/nG/R/G) at single cell stage and heat-shocked at 1 day-post-fertilization (dpf) for 2 hours. The same embryo was imaged once per day to 11dpf. The persistence of labeling indicates genomic insertion of Multibow cassettes. Red patches around the eye and along the gut are auto-fluorescence. Enlarged views of white boxed areas show that the area is stably fluorescent. Scale bar in enlarged views: 100µm. c. Label stability of color codes over time. The embryo was injected with 12 (B/G/Y/R) Multibow constructs at one cell stage. Heat-shock of this tg(hsp70:cerulean-cre) individual was at 30hpf (duration: 2 hours). Its developing larval tail fin was imaged every 24 hours starting at 54hpf using four channels (B/G/Y/R). The color codes of the cells remain unchanged despite fluorescent intensity differences at different days, allowing identification of the same cells/clones(e.g., α and β, shown in enlarged regions marked by white boxes). Color codes: α: nG/nY; β: mB. Scale bar: 100µm. See also Fig d in S2 Fig. |
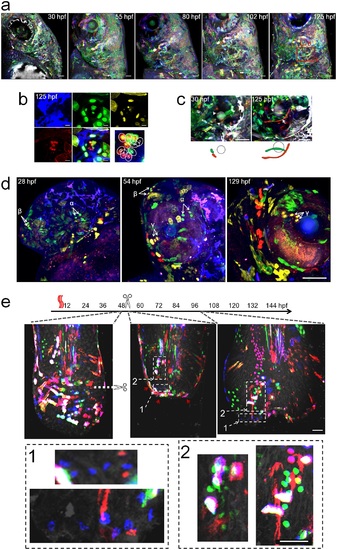
Examples of Multibow Cell Tracing in Development and Regeneration. a. Cranial facial development mapped by Multibow. The embryo was heat-shocked at 6hpf. 4 channels (B/G/Y/R) were used. The left face of the larva was imaged. Red boxes: regions highlighted in b. and c.. Scale bars: 50µm. b. Lineage relationship between neuromast hair cells. Dashed line circle indicates the hair bundle. Multibow labeled hair cell color codes: 1(mB/nY/R), 2(mB/mG/nR), 3(mB), 4(nG), 5(mB/nR), 6(R). The same pattern was already observed at 30hpf. Scale bars: 10µm. c. Identification of cells that undergo remarkable morphological changes during semicircular canal formation. Arrows: initial locations of the two mesenchymal cells that span the projection later. Grey circle: posterior otolith. Scale bars: 50µm. d. Clonal expansion near the eye over long time periods. The embryo was injected with 12 constructs (B/G/Y/R) and heat-shocked at 10hpf. Arrows indicate locations of identified clones α (nG), β (nG/R), γ (nY/mR). These clones can be seen amplified in number at 54hpf or 129hpf (α: 2 to 4; β: 2 to 4; γ: 2 to 3). Scale bar: 100µm. e. Multibow analysis of regeneration in the larval tail. Heat-shock labeling (1 hour), amputation and imaging were performed as labeled in the timeline. Immediately after amputation, the tissue shrank and cells near the wound converged (the images overlay may appear to be slightly out of register due to the changes of the live tissue during the acquisition of different channels, cell identification is not affected as these changes are small and predictable). By 2 days after amputation, most cells that had converged at the frontier of the wound were gone (their unique color codes disappeared, red arrowheads). The regenerated tissue came from clonal expansion of cells away from the frontier (highlighted examples in enlarged view from the white boxes 1 and 2). These clones show lineage restriction to the original cell type (the morphology of cells in the same clone remains similar, e.g., the blue cells in box 1 increased in number while size and shape do not have major changes.). Scale bars: 50µm. |
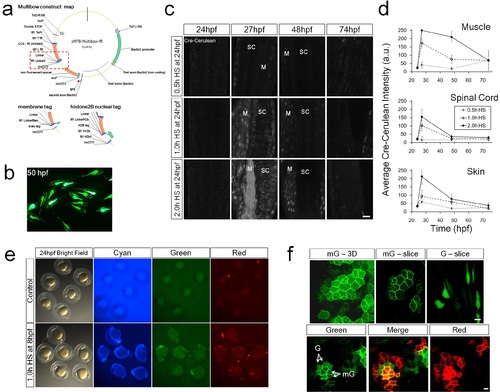
Design and Validation of Multibow. a. Multibow construct map for use in the Zebrafish system. Example construct is pMTB-Multibow-fR(mKate2). Red box: variable region where membrane and nuclear tagged versions are different from the map. See sequence files for details. See also S1 Table. b. Mosaic and uneven distribution of injected DNA. Embryos were injected at 1-cell stage with 20ng/µl pMTB-citrine DNA construct. Yolk is bright with autofluorescence. c. Analysis of Cre level dynamics in tg(hsp70:cerulean-cre). SC, spinal cord. M, muscle. 0.5h heat-shock does not induce significant Cerulean-Cre expression. Muscle cell expression is more sensitive to heat-shock. Low level expression is also present in some muscle cells without heat-shock. 1.0h heat-shock provides an optimal pulse. Scale Bar: 10µm. d. Average fluorescent intensities (+/- s.d.) measured in 10 nuclei from the images in c. e. Onset of Multibow after heat-shock induced Cre expression. The whole pool of 21 constructs were injected. The time required for Multibow to become detectable after Cre induction limits its application for lineage tracing in early stage zebrafish embryos before 20 hours post fertilization (hpf). However, the early stages are often more feasible for direct live imaging based lineage analysis [12,13,31]. f. Distinction of membrane and cytoplasmic signals. In 3D projection images (most of the figures) it may be difficult to distinguish signals of membrane and cytoplasmic origin, as bright membrane signal is often detectable in cytoplasm and in 3D overlay the signals overlap. Looking through original confocal slices removes most of the difficulties. The top images show a comparison of membrane signal in 3D rendering and slice view, and a slice view of a cytoplasmic signal. The main distinction is a bright edge and fuzzy cytoplasmic signal for membrane FPs and a homogenous signal throughout for untagged FPs. Bottom images show the contrast of neighboring cells with membrane labeled vs. untagged FPs of the same color. Difficulties may rise when trying to distinguish the presence of both membrane and cytoplasmic signals of the same FP when the membrane signal is much brighter (See Discussion). |
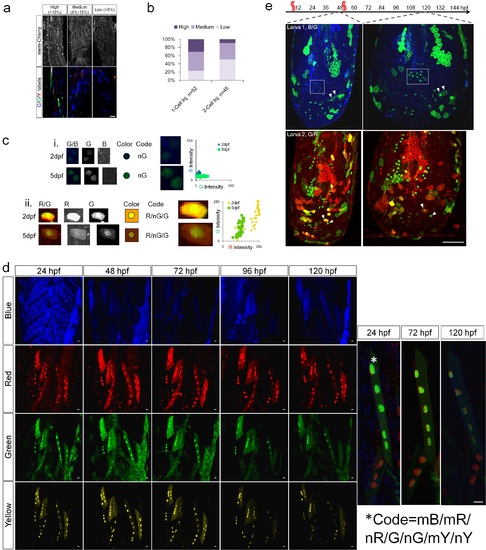
Coverage and Stability of Color Codes. a. Cell fraction coverage of Multibow analyzed by co-injecting the complete Multibow cocktail with mem-cherry mRNA. The presence of a strong Red ubiquitous marker (mem-cherry) excludes labeled cells by mR/R to be identified. The actual fraction using all Multibow channels may be higher. The coverage is categorized as "high", "medium" and "low" depending on the fraction of cells labeled. Scale Bar: 10µm. b. Summary of injected embryos by fraction of Multibow labeled cells as categorized in panel a. 1-Cell stage injection is critical for higher fraction of labeled cells. c. (i) Example cells in which background intensity in Blue channel has dropped while nG intensity increased. (ii) Example cell in which both total and relative intensity of FPs have changed. These cells appear to have changed “color” but can be identified based on the unchanged ON/OFF status of individual tagged FPs. Pixel channel intensity distribution of cells were further analyzed in down-sampled images of 1/8 original pixel number (down-sampling was used to reduce the number of pixels to analyze). The RGB intensity values of pixels belonging to the cells were plotted for both time points. The colors of the same cell(s) may change as a result of signal changes between different acquisition times, as reflected by a shift of pixel distribution in the RGB color space. The cells were from experiments in panel e. d. Label stability of color codes to intensity changes. A lateral region of a group of labeled muscle cells were followed for 5 days after injection of 12 Multibow constructs (R/G/Y/B) and heat-shock for 1 hour at 22hpf. The expression profiles of the same cells are invariant during this time despite intensity fluctuations. Four channels were used. Note the 24hpf blue image shows ubiquitous labeling of nuclei by the heat-shock induced Cre-Cerulean expression in this tg(hsp70:cerulean-cre) individual, which fades away afterwards (See also Fig c in S1 Fig). The enlarged merged views show an example cell that apparently changed color due to intensity fluctuations but kept the same Multibow barcode. Scale bars: 10µm. e. Intensity fluctuation tests. The embryos were injected with 6 constructs (B/G for the upper panel and G/R for the lower panel, respectively). Heat-shock labeling and imaging were performed as labeled in the timeline. The tissue undergoes growth, and clonal expansion of labeled cells is evident (boxes in the upper panel). The color codes remain unchanged (e.g. arrowheads in the lower panel) even though the intensities of expression may change (boxes in the upper panel). No new color codes appear after the second heat-shock, indicating completion of recombination by the first heat-shock. Scale Bar: 100µm. |
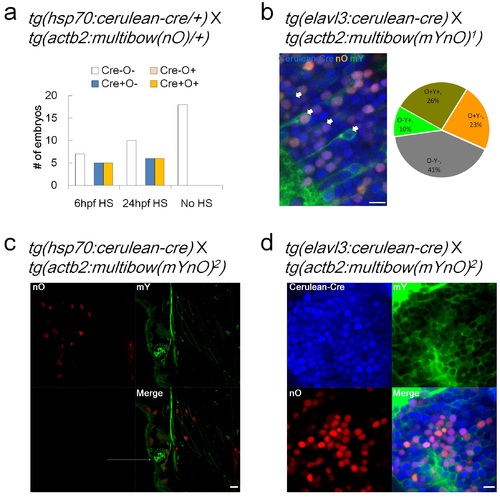
Analysis of Multibow Transgenic Lines. a. Validation of a single color Multibow line (tg(actb2:multibow(nO)/+)). Multibow transgenic lines were crossed with a Cre driver line as indicated on the top (Same for following panels). Multibow cells were scored to determine the onset of Multibow labeling after Cre addition and distribution of color codes. HS, heat-shock at indicated times (duration: 3 hours). b. A double color Multibow line (tg(actb2:multibow(mYnO)1)) showing ~60% cell coverage and bias towards more nO+ cells. Superscript indicates line number from independent founders. Arrows, example of each of the 4 color codes. Image is a lateral confocal slice of the hindbrain, 2dpf. All scale bars: 10µm. c. Another double color Multibow line (tg(actb2:multibow(mYnO)2)) showing mY+ cells cover all nO+ cells, the code of mY/nO+ is lost in this line. Arrows: mY+/nO- cells. Image is a lateral confocal slice of the trunk, 2dpf, heat-shocked at 12hpf. d. This line (same as in panel c.) shows very strong coverage of mY+ cells (few mY- cells when Cre expression is constitutive), reducing diversity of color codes. Image is a lateral optical slice of the brain, 2dpf. |