
- Title
-
Tight junction protein 1a regulates pigment cell organisation during zebrafish colour patterning
- Authors
- Fadeev, A., Krauss, J., Frohnhöfer, H.G., Irion, U., Nüsslein-Volhard, C.
- Source
- Full text @ Elife
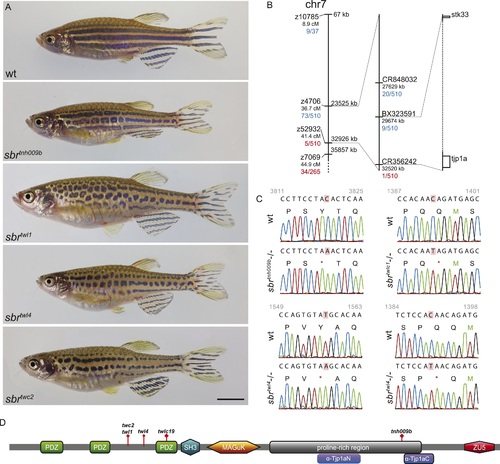
(A) All alleles of sbr exhibit interrupted, undulating dark stripes of normal arrangement and width when compared to wild type, but no other obvious defects. Scale bar: 5 mm. (B) Scheme of meiotic mapping of sbr. Marked are z-markers and contigs on which SNPs were found with their genomic and genetic (where applicable) coordinates. The numbers of recombinants among all fish tested are given in red and blue. The right-most bar shows genes on the ends of the final mapped region. The dotted region is not to scale and contains multiple genes. (C) DNA sequence traces for four alleles of sbr. Red rectangles mark the mutated residues. Red asterisks stand for stop codons. (D) Scheme of Tjp1a protein. Purple rounded squares indicate regions corresponding to polypeptides used for antibody generation. Red diamonds show the positions of stop codons in the mutants. PHENOTYPE:
|
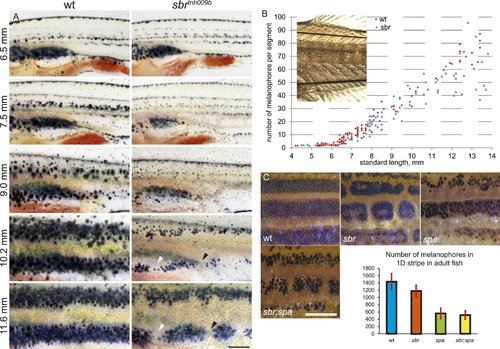
(A) Pigment pattern during metamorphosis in the mid-trunk of individual wild type and sbr mutant fish. Arrowheads: forming interruptions. White arrowheads: disappearing melanophores (N = 6). Scale bar: 1 mm. (B) Average number of melanophores per segment in the first two dark stripes in wild type and mutant fish plotted against standard length. Red circles—individual wild type fish; blue squares—individual sbr fish. Inset shows the area where melanophores were counted. Distributions of melanophore numbers in mutants and wild type fish do not differ significantly until the 10 mm stage as shown by Kolmogorov–Smirnov statistics. At 10–14 mm stages the distributions are different with p-values < 0.05. (C) Close-ups of mid-trunk regions of adult wild type, sbr, spa and spa;sbr and melanophore numbers in a dark stripe dorsal to the first light stripe of adult fish. Red lines—standard deviation. Scale bar: 2 mm. PHENOTYPE:
|
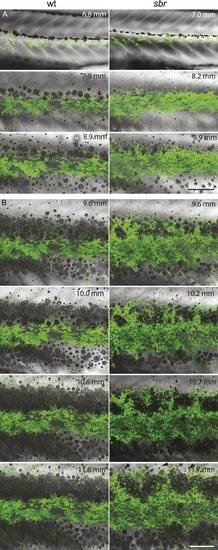
(A) Repeated imaging of Tg(TDL358:GFP) wild type and mutant metamorphic individual (N = 5 each, one shown). Scale bar: 300 µm. (B) Same individuals with another magnification. Empty patches in the light stripe of wild type fish are caused by variegation of the transgene expression. Arrowheads: loose iridophores. Scale bar: 300 µm. EXPRESSION / LABELING:
PHENOTYPE:
|

Invading sbr iridophores occasionally retreat. Iridophores (marked with the yellow outline) are retreating from the area between two groups of melanophores. Scale bar: 150 µm. |
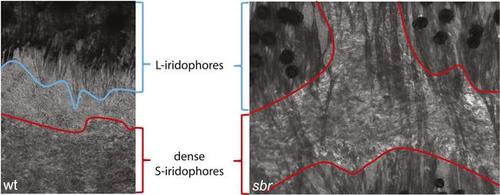
In wild type dense S-iridophores and L-iridophores are separated, but in sbr L-iridophores can be observed in S-iridophore area of light stripes. Pigment assembles in the centres of melanophores due to prolonged light exposure prior to fixation. |
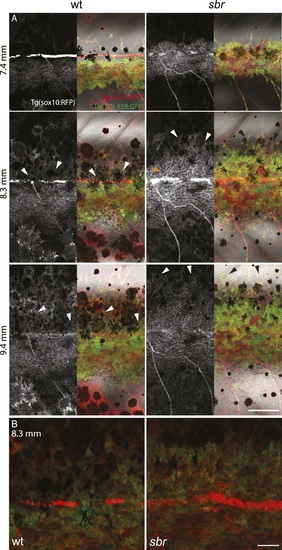
(A) Tg(TDL358:GFP); Tg(sox10:mRFP) wild type and sbr metamorphic fish (N = 4 each, one shown). Arrowheads point to delaminating loose iridophores. Arrow shows dense iridophores failing to delaminate. Scale bar: 150 µm. (B) Close-ups of Tg(TDL358:GFP); Tg(sox10:mRFP) wild type and sbr metamorphic fish 8.3 SL. Note difference in iridophore shapes in wild-type. Scale bar: 50 µm. EXPRESSION / LABELING:
PHENOTYPE:
|
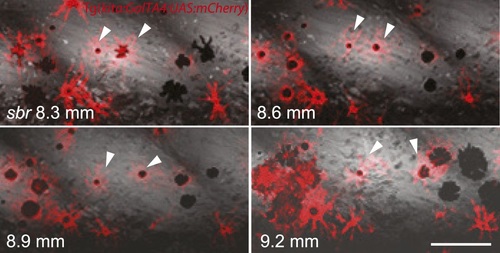
Two closely positioned melanophores in sbr (arrowheads), are migrating away from the iridophores in posterior and anterior directions. Scale bar: 100 µm. EXPRESSION / LABELING:
|
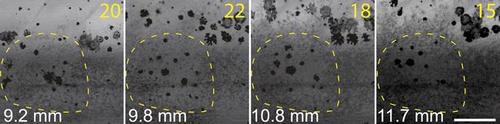
Melanophores trapped in the mass of iridophores are disappearing in sbr. Number of melanophores in the marked light stripe area is shown in the upper right corner. Scale bar: 200 µm. |
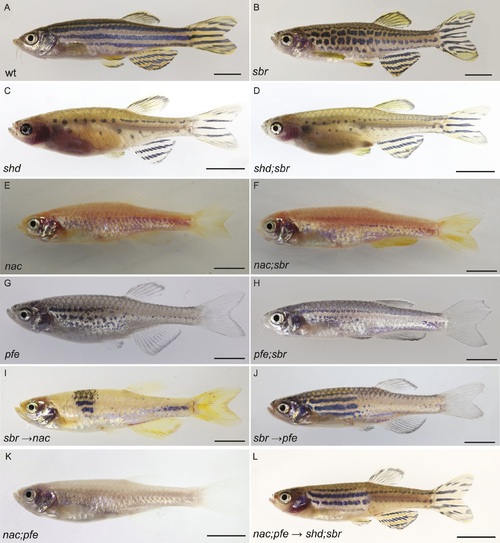
(A) Wild type fish. (B) sbr fish. (C) shady (shd) mutant, which lacks iridophores. (D) shd;sbr mutant is indistinguishable from shd. (E) nacre (nac) mutant, which lacks melanophores. (F) nac;sbr double mutant exhibiting expanded dense iridophore areas in comparison to nac alone. (G) pfeffer(pfe) mutant, which has no xanthophores. (H) pfe;sbr double mutant exhibiting expanded dense iridophore areas in comparison to pfe alone. (I) Chimeras, obtained from transplantation of sbr blastomeres into nac recipient blastulas, show clonal rescue. (J) Chimeras obtained from transplantation of sbr blastomeres into pfe recipient blastulas, show clonal rescue. (K) nac;pfe fish have only one type of pigment cells—iridophores. (L) Chimeras obtained from transplantation of nac;pfe blastomeres into shd;sbr recipient blastulas, show clonal rescue. Scale bars: 5 mm. PHENOTYPE:
|
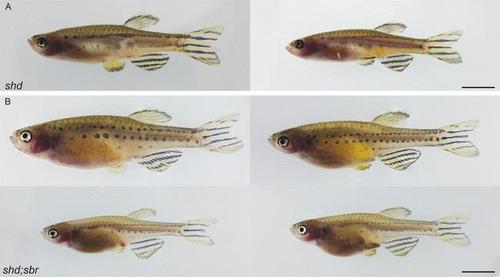
Phenotypes of shd and shd;sbr mutants. Shown are (A) shd and (B) shd;sbr. Scale bars 5 mm. |
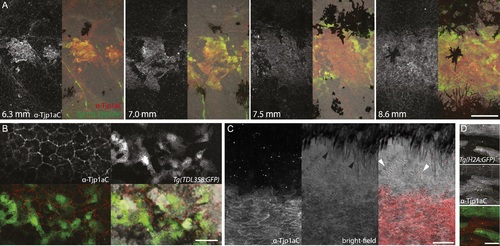
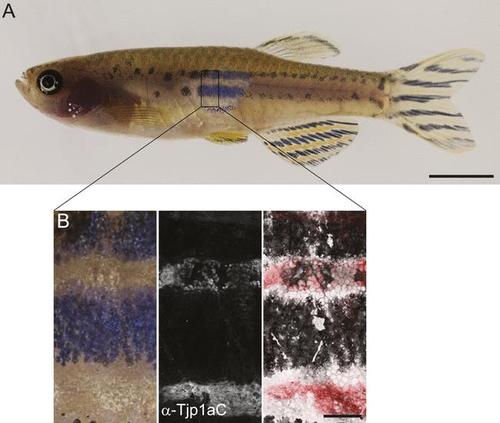
(A) Double antibody staining of metamorphic Tg(TDL358:GFP) fish with α-Tjp1aC and α-GFP antibodies. Note: not all iridophores are expressing GFP due to transgenic line variegation. Scale bar: 100 µm. (B) Loose iridophores migrating over the dark stripe in 8.3 mm metamorphic Tg(TDL358:GFP) fish express GFP, but not Tjp1a, although the epithelial staining is still visible. Scale bar: 30 µm. (C) α-Tjp1aC staining in skin of adult wild type fish. The protein is detected in the sheet of dense S-iridophores of the light stripe, but not in L-iridophores (black arrowheads), loose iridophores (white arrowheads), melanophores or xanthophores. Scale bar: 100 µm. (D) Double antibody staining with α-Tjp1aC and α-GFP of skin of adult chimera, obtained by transplanting sbr;Tg(H2A:GFP) blastomeres into wild type blastula. Either GFP or Tjp1a was detected in cells, never both. Some sbr cells express no GFP due to variegation of the transgene expression. Scale bar: 30 µm. EXPRESSION / LABELING:
|
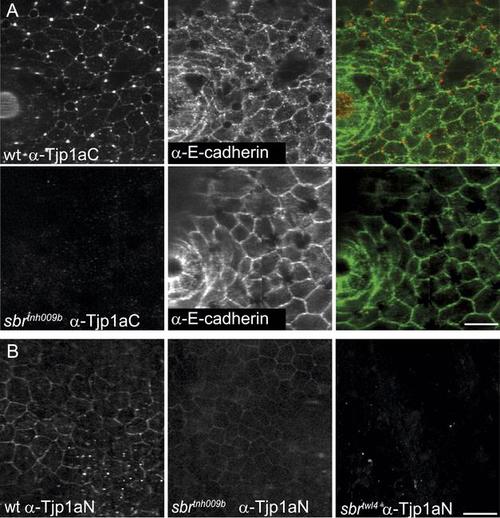
(A) α-Tjp1aC staining in adult wild type fish skin sample shows signal colocalizing with E-cadherin, expressed in epithelial cells. In adult sbr tnh009b skin samples the Tjp1a staining is not observed, but E-cadherin is detected. Scale bar: 20 µm. (B) α-Tjp1aN antibody stains skin epithelium of both wild type and sbr tnh009b adult fish but not sbr twl4. Scale bar: 20 µm. EXPRESSION / LABELING:
|
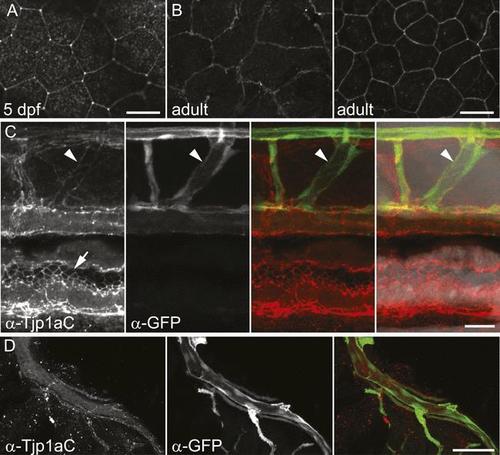
(A) Signal in epithelium of wild type 5 dpf larva stained with α-Tjp1aC. Scale bar: 20 µm. (B) Signal in two layers of adult wild type epithelium (about 7 µm apart) stained with α-Tjp1aC st. Scale bar: 20 µm. (C) Double staining of whole-mount Tg(kdrl:GFP) 5 dpf larvae with α-Tjp1aC and α-GFP demonstrates the expression of Tjp1a in blood vessels (arrowheads) and intestinal epithelium (arrows). Scale bar: 20 µm. (D) α-Tjp1aC staining shows expression of Tjp1a in vasculature of adult Tg(kdrl:GFP) animal. Scale bar: 50 µm. |
(A) shd;sbr with nac;pfe clones show rescue of the wild type phenotype. Scale bar: 5 mm. (B) Immunostaining of shd;sbr with nac;pfe clone with α-Tjp1aC antibody demonstrates the presence of the protein in dense iridophores but not in the epithelium. Scale bar: 500 µm. |
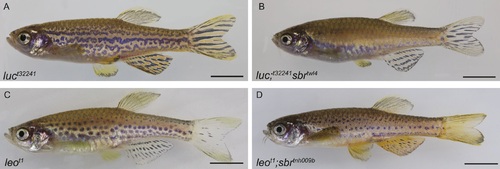
(A) luchst32241 (luc) mutant affects Cx39.4 and results in meandering and broken stripes. (B) luchst32241;sbrtwl4 mutant exhibits complete loss of stripes and expansion of dense iridophore area. (C) leopardt1 (leo, cx41.8) stripes are broken into spots. (D) leot1;sbrtnh009b double mutant displays decrease in the size of the spots. Scale bars: 5 mm. PHENOTYPE:
|