
- Title
-
Efficient cargo delivery into adult brain tissue using short cell-penetrating peptides
- Authors
- Kizil, C., Iltzsche, A., Thomas, A.K., Bhattarai, P., Zhang, Y., Brand, M.
- Source
- Full text @ PLoS One
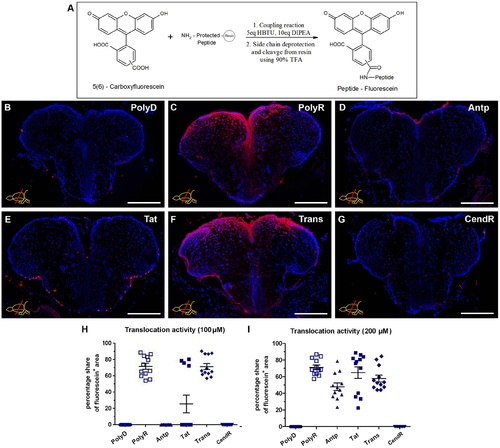
Overview of Peptide Translocation in the Telencephalon upon 100 µM Injection, and Dose-dependence. (A) Reaction scheme for the coupling of 5(6)-carboxyfluorescein to peptides. Fluorescein immunohistochemistry (IHC) on rostral telencephalon of peptide (B) control PolyD, (C) PolyR, (D) Antp, (E) Tat 49–57, (F) Trans and (G) CendRP injected brains. Graphs depict the average area of peptide translocation in one telencephalic hemisphere, upon 100 µM dose injection (H) and upon 200 µM dose injection of CPPs (I). Scale bars: 200 µm, n = 3, data are mean ± s.e.m. |
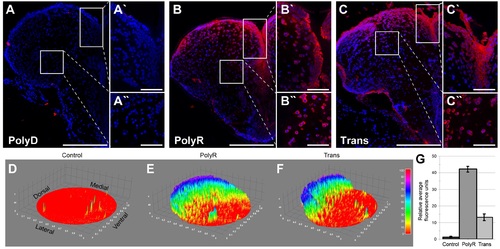
High Magnification Images of the Translocation of the Peptides PolyR and Trans with Surface Plots. Fast-Red staining of cryosections upon 100 µM dose injection of peptides. (A) Control peptide PolyD does not translocate; neither into the ventricular area (A′) nor parenchyma (A′′). (B) PolyR shows strong translocation in the ventricular area (B′) yet also into the parenchyma (B′′). (C) Brain section showing Trans localization in ventricular area (B′) and parenchyma (C′′). Scale bars: 200 µm in A, B, C overviews; 50 µm in A, B, C insets. |
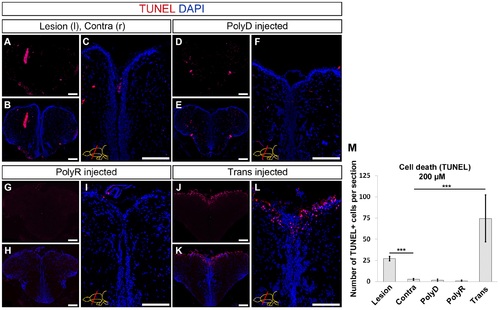
Quantification of Cell Death upon Peptide Injection. (A) TUNEL staining on rostral telencephalon of stab-lesioned brain, used as control. Lesioned hemisphere left and unstabbed contralateral hemisphere right. (B) DAPI counterstaining on A. (C) Magnified medial ventricular region of B. (D) TUNEL upon PolyD injection and DAPI counterstaining (E). (F) High magnification of medial ventricular region of E. (G) TUNEL staining on PolyR-injected brain and DAPI counterstaining (H). (J) TUNEL on Trans-injected brain. (K) DAPI counterstaining on J and high magnification of medial ventricular region (L). (M) Quantification of TUNEL-positive cells per telencephalic hemisphere. Scale bars = 100 µm, n = 3, data are mean + s.e.m. |
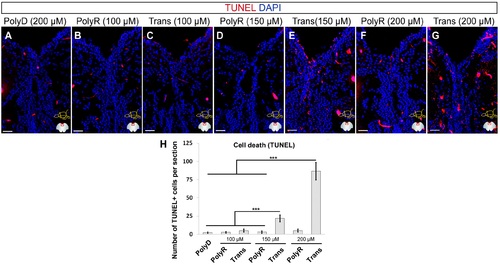
Dose-dependency of Cell Death Response. TUNEL staining on rostral telencephalon of PolyD (200 µM, A), PolyR (100 µM, B; 150 µM, D; 200 µM, F), and Trans (100 µM, C; 150 µM, E; 200 µM, G) peptide-injected brains. (H) Quantification of TUNEL-positive cells. DAPI is used for nuclear counterstaining (blue). Scale bars = 100 µm, n = 4, data are mean + s.e.m. |
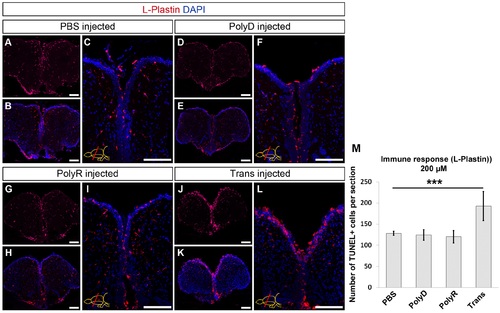
Immune Response after Peptide Injection. (A) L-Plastin immunohistochemistry (IHC) on PBS injected brain, used as control. (B) DAPI counterstaining on A. (C) Magnified medial ventricular region of B. (D) L-Plastin IHC upon PolyD injection and DAPI counterstaining (E). (F) High magnification of medial ventricular region of E. (G) L-Plastin IHC on PolyR injected brain and DAPI counterstaining (H). (J) L-Plastin IHC on Trans injected brain. (K) DAPI counterstaining on J and high magnification of medial ventricular region (L). (M) Graph depicts the quantification of L-Plastin-positive cells per telencephalic hemisphere. Scale bars: 100 µm, n = 3, data are mean + s.e.m. |
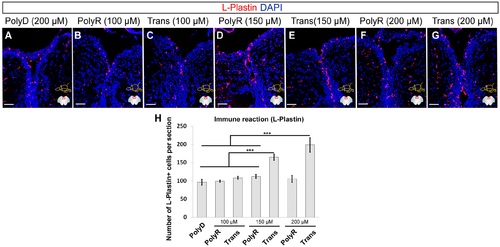
Dose-dependency of Immune Response. L-Plastin immunohistochemical staining on rostral telencephalon of PolyD (200 µM, A), PolyR (100 µM, B; 150 µM, D; 200 µM, F), and Trans (100 µM, C; 150 µM, E; 200 µM, G) peptide-injected brains. (H) Quantification of L-Plastin-positive cells. DAPI is used for nuclear counterstaining (blue). Scale bars = 100 µm, n = 4, data are mean + s.e.m. |
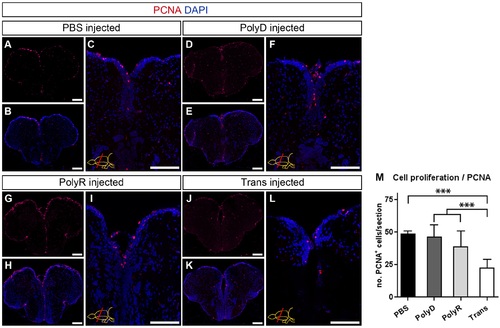
Cell Proliferation after Peptide Injection. (A) PCNA immunostaining on PBS-injected brains. (B) DAPI counterstaining on A. (C) Magnified medial ventricular region of B. (D) PCNA immunostaining on PolyD (control)-injected brains. (E) DAPI counterstaining on D. (F) Magnified medial ventricular region of E. (G) PCNA immunostaining on PolyR-injected brains. (H) DAPI counterstaining on G. (I) Magnified medial ventricular region of H. (J) PCNA immunostaining on Trans-injected brains. (K) DAPI counterstaining on J. (L) Magnified medial ventricular region of K. (M) Quantification of PCNA+ cells per telencephalic hemisphere section. Scale bars = 100 µm, n = 3 for every dataset, data are mean + s.e.m. |
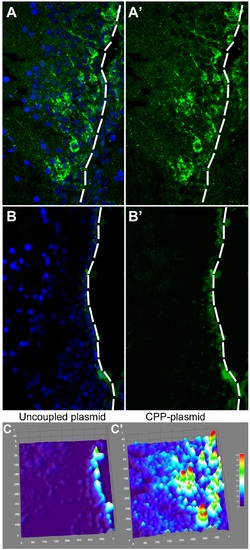
Delivery of Plasmid DNA with PolyR. (A) GFP immunohistochemistry (IHC) and DAPI staining on brains injected with PolyR-coupled GFP-expression plasmid. (A′) Green channel alone. (B) GFP immunohistochemistry (IHC) and DAPI staining on brains injected with uncoupled GFP-expression plasmid. (B′) Green channel alone. (C) Surface plot projection of the fluorescence intensity in brains injected with uncoupled plasmid. (C′) Surface plot projection of the fluorescence intensity in brains injected with PolyR-coupled plasmid. |