
- Title
-
The adhesion GPCR GPR126 has distinct, domain-dependent functions in Schwann cell development mediated by interaction with laminin-211
- Authors
- Petersen, S.C., Luo, R., Liebscher, I., Giera, S., Jeong, S.J., Mogha, A., Ghidinelli, M., Feltri, M.L., Schöneberg, T., Piao, X., Monk, K.R.
- Source
- Full text @ Neuron
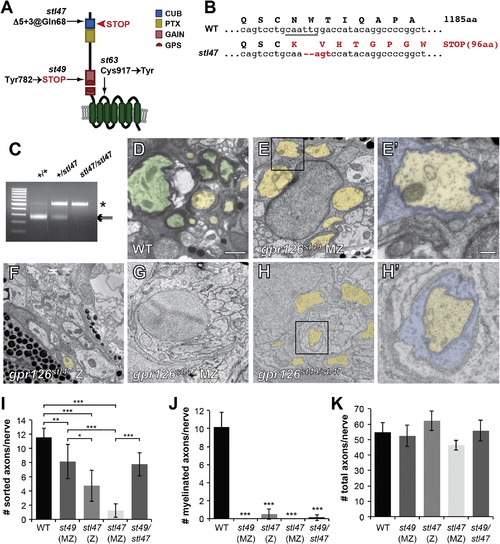
Gpr126-NTF Is Necessary and Sufficient for Radial Sorting (A) Schematic representation of zebrafish Gpr126 showing stl47, st49, and st63 alleles. The red arrowhead indicates the STOP codon in stl47. (B) Sequence of WT versus gpr126stl47 alleles. WT gpr126 encodes an 1,185 aa protein. stl47 has a Δ5+3 indel that truncates the protein at aa 96. The TALEN-targeted MfeI site is underlined. (C) Restriction fragment length analysis used to genotype gpr126stl47. WT PCR product is cleaved into 257 and 241 bp fragments by MfeI (arrows). stl47 retains the undigested 498 bp product (asterisk). (D–H) TEM of 5 dpf zebrafish showing cross-sections through the PLLn. Boxed regions in (E) and (H) indicate magnification in (E′) and (H′). The scale bars represent 1 µm (D–H) and 0.2 µm (E′ and H′). (D) Axons are sorted (pseudocolored yellow) and myelinated (pseudocolored green) in a WT nerve. (E) SCs (blue in E′) sort axons but arrest at the promyelinating state in an MZ gpr126st49 mutant. (F and G) Both radial sorting and myelination are impaired in Z (F) and MZ gpr126stl47 (G) mutants. (H) Radial sorting is rescued in a gpr126st49/stl47 transheterozygote. (I–K) Quantification of TEM images. Bars represent means ± SD. p < 0.05, p < 0.01, p < 0.001, one-way ANOVA with Bonferroni’s multiple comparisons test. (I) Number of sorted axons (ensheathed by 1–1.5 wraps SC cytoplasm) per PLLn. (J) Number of myelinated axons (>1.5 wraps SC cytoplasm) per PLLn. All mutants were compared to WT for statistical analysis. (K) Number of total axons per PLLn. PHENOTYPE:
|
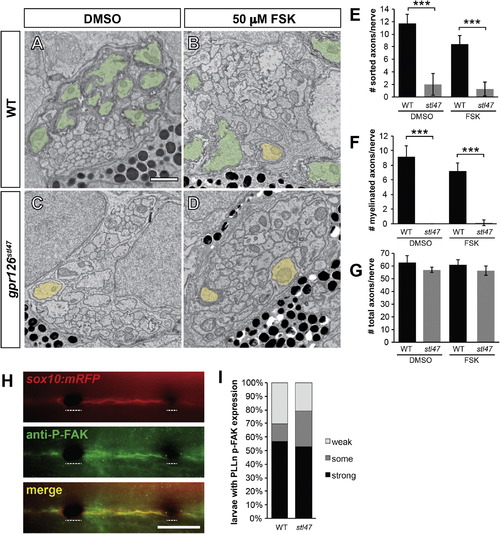
Gpr126-NTF Radial Sorting Occurs Independently of Gpr126-CTF and p-FAK Signaling (A–D) TEM of 5 dpf zebrafish showing cross-sections through the PLLn. Sorted and myelinated axons are defined and pseudocolored as in Figure 1. The scale bar represents 1 µm. (A and B) Radial sorting and myelination are observed in WT siblings treated with DMSO (A) and 50 µM FSK (B). (C and D) Radial sorting and myelination are impaired in gpr126stl47 zygotic mutant siblings treated with DMSO (C) and FSK (D). (E–G) Quantification of TEM images. Bars represent means ± SD. p < 0.001, one-way ANOVA with Bonferroni’s multiple comparisons test. (E) Number of sorted axons per PLLn. (F) Number of myelinated axons per PLLn. (G) Number of total axons per PLLn. (H) Phosphorylated FAK (P-FAK) immunostaining (green) labels PLLn SCs of a 4 dpf WT Tg(sox10:mRFP) larva (red). Dotted lines indicate regions where pigment cells obscure fluorescence. The scale bar represents 100 µm. (I) Quantification of p-FAK levels expressed as a percentage of larvae with SC-specific p-FAK immunostaining along the PLLn in WT and gpr126stl47 mutants. No significant difference was observed in either genotype. |
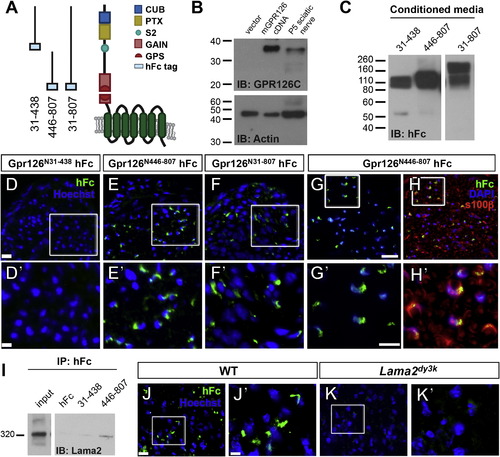
GPR126-NTF Binds SC-Derived Lama2 (A) Diagram showing domains in human GPR126-NTF and fusion constructs for three different GPR126-NTF fragments. (B) Detection of GPR126 cleavage in vitro and in vivo. P6 mouse sciatic nerve and 293T cells transfected with either mouse Gpr126 cDNA or empty vector were lysed and immunoblotted with rabbit anti-GPR126 CTF antibody. A specific 35 kDa GPR126 CTF was detected in Gpr126-transfected cells and in P6 mouse sciatic nerve. IB, immunoblotting. (C) Fusion constructs were transfected into HEK293T cells to generate fusion recombinant proteins. Purified proteins were verified by western blot. Two bands were detected in GPR126N31–807 transfected media due to the second cleavage between aa 440 and 441; the higher band is full-length NTF. (D–F) Putative ligand binding on P3 sciatic nerves. Anti-hFc immunostaining is green and nuclear counterstain is Hoechst 33342 (blue). Magnification of boxed regions in (D)–(F) (the scale bar represents 20 µm) is indicated in (D′)–(F′) (the scale bar represents 10 µm). (D) No binding was detected with the GPR126N31–438 hFc fragment. (E and F) The GPR126N446–807 (E) and full-length GPR126N31–807 hFc (F) fragments reveal the same ligand binding pattern. (G and H) The GPR126N446–807 hFc fragment (green) colocalizes with SCs marked by S100β (red) in P10 sciatic nerves. Nuclear counterstain is 42,6-diamidino-2-phenylindole (DAPI) (blue). The scale bars represent 20 µm (G and H) and 10 µm (G′ and H′). (I) GPR126N446–807 binds Lama2 in vivo. GPR126N446–807 and GPR126N31–438 proteins were mixed with P3 sciatic nerve lysate and immunoprecipitated with anti-hFc antibodies. Lama2 specifically coimmunoprecipitates with GPR126N446–807. Input: 15 s exposure; Lama2, 1 min exposure. IP, immunoprecipitation. (J and K) Putative ligand binding performed on P10 sciatic nerves of WT and Lama2dy3k/dy3k mice. Anti-hFc immunostaining is green and nuclear counterstain is Hoechst 33342 (blue). Magnification of boxed regions in (J) and (K) (the scale bar represents 10 µm) is indicated in (J′) and (K′) (the scale bar represents 2.7 µm). GPR126N446–807 binding is robust in WT sciatic nerve (J) but not detected in Lama2dy3k mutant sciatic nerve (K). |
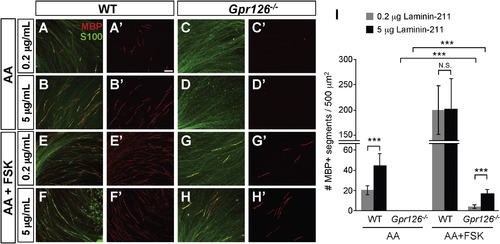
Laminin-211 Concentration Modulates In Vitro Myelination (A–H) In vitro myelination cultures from WT or Gpr126/ DRGs on plates coated with poly-D-lysine + 0.2 or 5 µg/ml Laminin-211. Cultures were immunostained with MBP (red) and S100 (green). The scale bar represents 100 µm. (A and B) Three weeks after ascorbic acid (AA) addition to WT, more MBP+ immunostaining is observed on 5 µg/ml Laminin-211 than 0.2 µg/ml 3 weeks after AA addition. (C and D) MBP+ immunostaining is not observed in Gpr126/ SCs at any Laminin-211 concentration 3 weeks after AA addition. (E and F) Addition of FSK leads to MBP potentiation in WT SCs on both 0.2 and 5 µg/ml Laminin-211 relative to AA alone. (G and H) Gpr126/ SCs have low levels of MBP in the presence of FSK and show concentration dependence for Laminin-211. (I) Quantification of myelination cultures. Bars represent the average number of MBP-positive segments per 500 µm2 ± SD. p < 0.001, Student’s t test; N.S., no significant difference. |
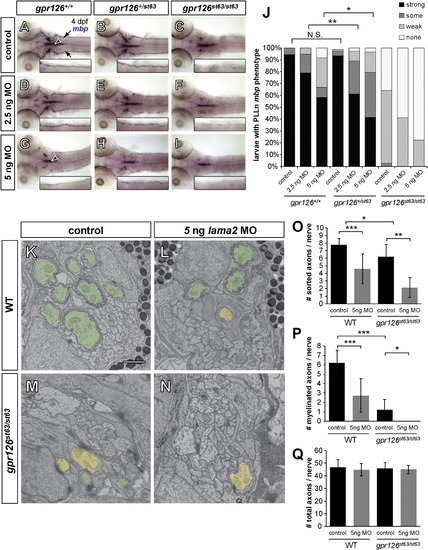
lama2 Knockdown Enhances gpr126 Hypomorphic Phenotype (A–I) Dorsal views of mbp expression by WISH in 4 dpf larvae. Insets: magnification of the right PLLn. Control, injected with phenol red dye only; MO, lama2 morpholino-injected. (A–C) Control-injected larvae. (A) mbp expression is strong in the PLLn of a WT (gpr126+/+) larva. Arrows indicate the PLLn, and the arrowhead indicates the CNS. (B) mbp in a heterozygous (gpr126+/st63) larva is indistinguishable from WT. (C) mbp is reduced, but not absent, in the PLLn of a homozygous gpr126st63/st63 hypomorph. (D–F) Larvae injected with low-dose (2.5 ng) lama2 MO. (D) mbp is not disrupted in a gpr126+/+ larva. (E) mbp is reduced in the PLLn of a heterozygous gpr126+/st63 larva relative to control-injected. (F) mbp is further reduced in a gpr126st63/st63 larva. (G–I) Larvae injected with high-dose (5 ng) lama2 MO. (G) mbp is disrupted in both the CNS (arrowhead) and PLLn in a gpr126+/+ larva. (H) mbp is further reduced in a heterozygous gpr126+/st63 larva. (I) mbp is nearly absent in the PLLn of a gpr126st63/st63 larva. (J) Quantification of WISH expressed as a percentage of larvae with each mbp PLLn phenotype at 4 dpf. Asterisks indicate a significant decrease of “strong” expression. p < 0.05, p < 0.01, Fisher’s exact test. Control, pooled uninjected and phenol red-injected. (K–N) TEM of 3 dpf zebrafish PLLn. Sorted and myelinated axons are defined and pseudocolored as in Figure 1. The scale bar represents 1 µm. (K and L) Myelination proceeds normally in a control-injected gpr126+/+ sibling (K), but radial sorting and myelination are reduced with 5 ng MO in gpr126+/st63 (L). (M and N) Myelination is reduced in a gpr126st63/st63 hypomorph (M), and is further reduced in a gpr126st63/st63 sibling injected with 5 ng MO (N). (O–Q) Quantification of TEM images. Bars represent means ± SD. p < 0.05, p < 0.01, p < 0.001, one-way ANOVA with Bonferroni’s multiple comparisons test. (O) Number of sorted axons per PLLn. (P) Number of myelinated axons per PLLn. (Q) Number of total axons per PLLn. EXPRESSION / LABELING:
PHENOTYPE:
|
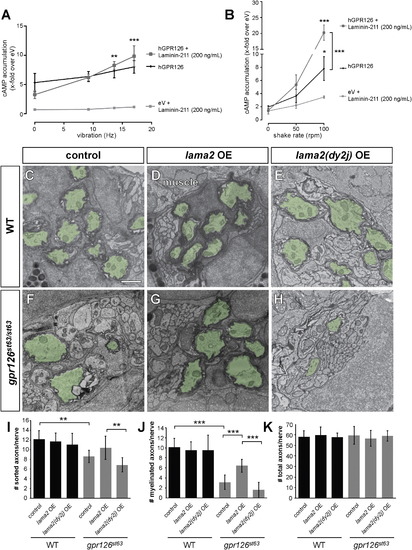
Laminin-211 Activates Gpr126 under Dynamic Conditions In Vitro and Polymerizing Conditions In Vivo (A and B) COS-7 cells were transiently transfected with empty vector (eV) and hGPR126 plasmid. cAMP accumulation was measured after stimulation with Laminin-211 (200 ng/ml) and the indicated force. Data are represented as mean ± SEM of three independent assays each performed in triplicate. p < 0.05, p < 0.01, p < 0.001, two-way ANOVA with Tukey’s multiple comparisons test (each mechanic-induced response was compared to static conditions for all hGPR126 data points, with and without Laminin-211). (A) Laminin-211 suppresses GPR126 signaling under stationary conditions (Hz 0) but causes a frequency-dependent increase of cAMP accumulation with increasing vibration. (B) Mechanical stimulation via shaking further enhances Laminin-211-dependent cAMP accumulation with increasing frequency. (C–H) TEM of 5 dpf zebrafish PLLn. Myelinated axons are pseudocolored in green. The scale bar represents 1 µm. (C–E) Myelination proceeds normally in a control larva (C), in a larva injected with 40 pg WT lama2 OE construct (D), and in a larva injected with 40 pg mutant lama2(dy2j) OE construct (E). (F) Myelination is reduced in a control-injected gpr126st63/st63 larva. (G) Injection of 40 pg lama2 OE rescues myelination in a gpr126st63/st63 larva. (H) Injection of 40 pg lama2(dy2j) OE fails to rescue myelination in a gpr126st63/st63 larva. (I–K) Quantification of TEM images. Bars represent means ± SD. p < 0.01, p < 0.001, one-way ANOVA with Bonferroni’s multiple comparisons test. (I) Number of sorted axons per PLLn. (J) Number of myelinated axons per PLLn. (K) Number of total axons per PLLn. |