
- Title
-
The Lowe Syndrome Protein OCRL1 Is Required for Endocytosis in the Zebrafish Pronephric Tubule
- Authors
- Oltrabella, F., Pietka, G., Ramirez, I.B., Mironov, A., Starborg, T., Drummond, I.A., Hinchliffe, K.A., Lowe, M.
- Source
- Full text @ PLoS Genet.
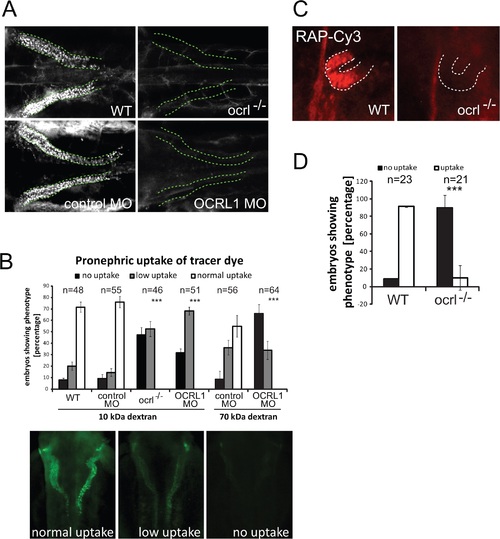
Impairment of pronephric uptake in OCRL1 deficient zebrafish embryos. A. Confocal images of wild-type (WT), ocrl-/- mutant, control morphant or OCRL1 morphant 72 hpf zebrafish embryos that were injected with Alexa 488-10 kDa dextran (white) and imaged after 2.5 h. The pronephric tubules are indicated with a green dashed line. B. Top: Quantification of pronephric uptake of 10 kDa (2.5 h) or 70 kDa dextran (4 h) in control, ocrl-/- mutant and morphant embryos. Bottom: Representation of normal, low and no dextran uptake in injected. C. Wild-type (WT) and ocrl-/- mutant embryos were injected with RAP-Cy3 (red) and pronephric accumulation after 60 min monitored by fluorescence microscopy. D. Quantification of pronephric uptake of RAP-Cy3 in control and ocrl-/- mutant embryos. Data are presented as the mean ± SD. Statistical analysis was performed using the Pearson’s chi-squared test. ***p < 0.0001. PHENOTYPE:
|
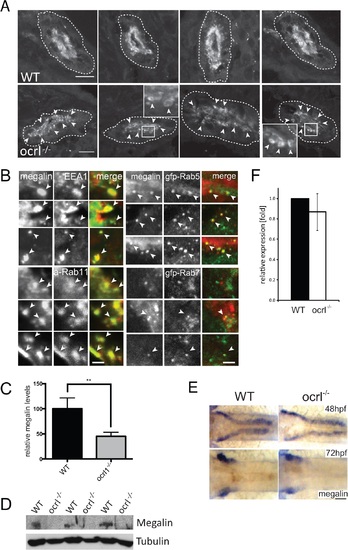
Megalin transcript and protein analysis in OCRL1-deficient zebrafish embryos. A. Transverse confocal images of the proximal pronephric region of wild-type (WT) and ocrl-/- mutant 72 hpf embryos labelled with anti-megalin antibodies. The white dashed lines indicate the outline of pronephric tubules. Arrowheads indicate sub-apical punctate and vacuolar megalin staining. B. Transverse confocal images of the proximal pronephric region of 72 hpf ocrl-/- embryos labelled with antibodies to megalin (green in left panel, red in right panel) and EEA1 (red) or GFP (gfp-, green) to detect ectopically expressed Rab5 or Rab7. mApple (a-) tagged Rab11 is in red. Arrowheads indicate colocalisation. C. Quantification of the relative fluorescence levels of megalin in confocal transverse sections of the indicated embryo types. D. Western blot of 72 hpf wild-type (WT) or ocrl-/- embryos with antibodies to megalin and tubulin. Three equivalent samples for genotype are analyzed. E. In situ hybridisation of megalin transcript in 48 hpf (top) and 72 hpf (bottom) wild-type (WT) or ocrl-/- embryos. F. Quantitative RT-PCR (qPCR) of megalin transcript levels in wild type and ocrl-/- embryos at 72 hpf. Data are presented as the mean ± SD. Statistical analysis was performed using the unpaired t-test. ***p < 0.0001. Scale bars in A, B and E represent 10, 2 and 20 µm respectively. EXPRESSION / LABELING:
PHENOTYPE:
|
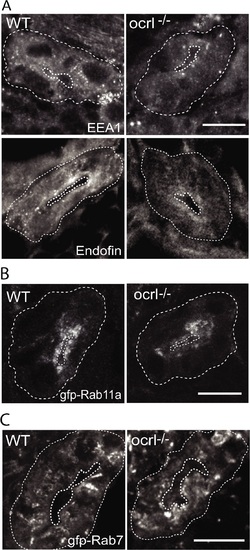
Reduced endosomal staining in OCRL1 deficient pronephros. A-C. Confocal transverse sections of the zebrafish proximal pronephric tubule of 72 hpf wild-type (WT) and ocrl-/- mutant embryos labelled with antibodies to EEA1 or endofin (A), or to GFP (B and C) to detect expressed GFP-Rab11 (B) or GFP-Rab7 (C). White dashed lines indicate the outline of pronephric tubules. Scale bars represent 10 µm. EXPRESSION / LABELING:
|
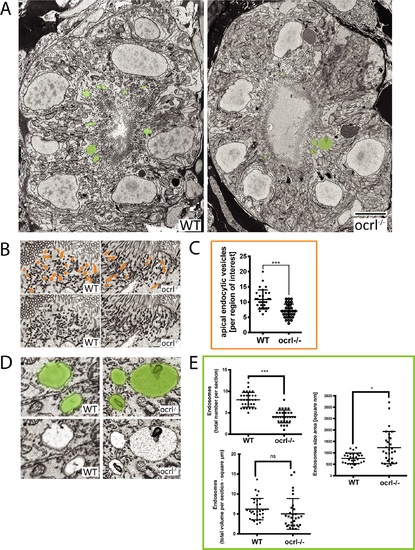
Electron microscopy analysis of endocytic compartments in OCRL1 deficient pronephros. A. Block face scanning electron microscopy (SEM) images of transverse sections through the zebrafish proximal pronephric tubule of wild-type and ocrl-/- mutant 72 hpf embryos. The apical membrane, identified by numerous microvilli, lines the central lumen of the pronephric tubule. Vacuolar endosomes are false coloured in green. B and D. Block face SEM showing apical endocytic vesicles at the apical pole of pronephric proximal tubule cells (false coloured in orange in top row) (B) and vacuolar endosomes (false coloured in green in top row) (D). C and E. Quantification of endocytic compartments. Numbers of apical endocytic vesicles were counted per region of interest (C), and vacuolar endosome number, size and total area were counted per entire section (E). Data are presented as the mean ± SD. Statistical analysis was performed using the unpaired t-test. ***p < 0.0001. Scale bars represent 5 µm (A), 2 µm (D) or 1 µm (B). PHENOTYPE:
|
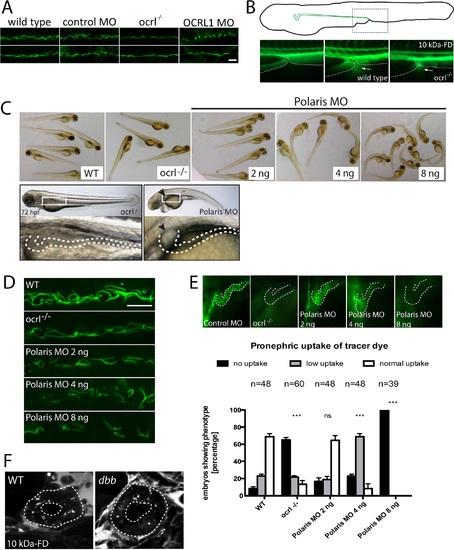
Pronephric cilia in ocrl-/- zebrafish. A. Confocal images of pronephric cilia, detected using anti-acetylated tubulin antibody, in wild-type, ocrl-/- mutant, control morphant or OCRL1 morphant zebrafish embryos (26hpf). B. Fluorescence dissecting microscope image of excretion of Alexa 488-10 kDa dextran from the cloacae of zebrafish embryos (72hpf). Bottom panels show cloacae immediately after injection (left) and excreting dextran 30–60s after injection (wild-type middle, ocrl-/- right). Dextran excretion was identical in control and ocrl-/- embryos (20 embryos of each genotype, 2 independent experiments). C. Brightfield images of wild-type (WT), ocrl-/- mutant or IFT88/polaris morphant (MO) embryos. The morphants were injected with different concentrations of morpholino as indicated. Embryos were imaged using brightfield microscopy. Bottom panel shows ocrl-/- mutant and polaris morphant (injected with 4 ng MO) and zoom of boxed area. The arrowhead indicates a pronephric cyst in the polaris morphant. D. Confocal images of pronephric cilia, detected using anti-acetylated tubulin antibody, in wild-type (WT), ocrl-/- mutant or IFT88/polaris morphant (MO) embryos. E. Wild-type (WT), ocrl-/- mutant and IFT88/polaris morphant embryos were injected with Alexa 488-10 kDa dextran (green) and pronephric accumulation after 2.5 h monitored by fluorescence microscopy. The pronephric tubules are indicated with a dashed line. Uptake was quantitated as indicated. Data are presented as the mean ± SEM. Statistical analysis was performed using the Pearson’s chi-squared test. ***p < 0.0001, **p < 0.001, *p < 0.01. F. Confocal transverse sections of the zebrafish proximal pronephric tubule of 72 hpf wild type and double bubble (dbb) cilia mutant showing 10 kDa-FD uptake into endocytic compartments in pronephric cells 2h after injection. Scale bars represent 10 µm (A and D). EXPRESSION / LABELING:
PHENOTYPE:
|
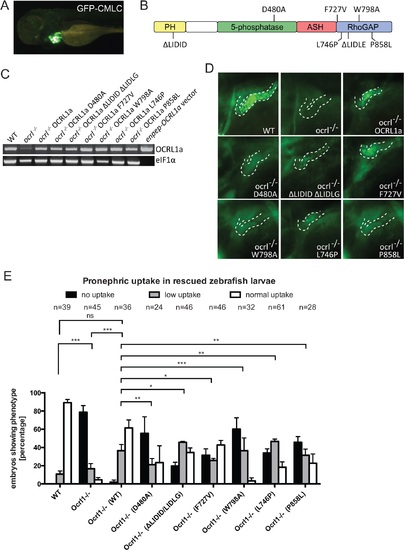
Rescue of the pronephric uptake defect in OCRL1 deficient embryos. A. Lateral view of a wild-type zebrafish embryo co-injected with cmlc2:GFP and enpep:OCRL1a. B. Schematic diagram of OCRL1 showing domain organization and localization of deletion and point mutants used in rescue experiments. C. RT-PCR detection of OCRL1 mRNA in WT, ocrl-/- embryos or ocrl-/- embryos expressing the indicated OCRL1a constructs. eIF1α was used as a control. The vector only lane is a positive control for the OCRL1 PCR, and lacks eIF1α. D. Images of pronephric uptake of Alexa 488-10 kDa dextran (green) in wild type (WT), ocrl-/- embryos or ocrl-/- embryos expressing OCRL1a, catalytically inactive GFP-OCRL1a (D480A), OCRL1a unable to bind clathrin (ΔLIDID ΔLIDLG), Rab GTPases (F727V), F&H domain proteins such as APPL1 and IPIP27A/B (W798A), or OCRL1a harbouring the Lowe syndrome mutation L746P or Dent-2 mutation P858L. The pronephric tubules are indicated with a dashed line. E. Quantification of pronephric uptake of Alexa 488-10 kDa dextran in each of the indicated embryo types. Data are presented as the mean ± SEM. Statistical analysis was performed using the Pearson’s chi-squared test. ***p < 0.0001, **p < 0.001, *p < 0.01. PHENOTYPE:
|
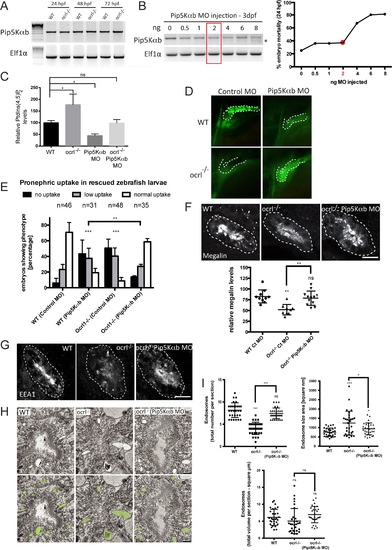
Rescue of the pronephric uptake defect in OCRL1 deficient embryos by suppression of PIP5K. A. RT-PCR detection of PIP5Kαb and eIF1α in wild-type and ocrl-/- embryos at the indicated developmental timepoints. B, left. RT-PCR of PIP5Kαb and eIF1α in 3 dpf zebrafish embryos injected with the indicated amount of PIP5Kαb splice morpholino. The asterisk indicates morpholino-induced abnormally spliced PIP5Kαb transcript. Right, mortality of PIP5Kαb morpholino-injected embryos at 24 hpf. C. PtdIns(4,5)P2 levels in untreated wild-type or ocrl-/- embryos or embryos injected with 2 ng PIP5Kαb morpholino. Data are presented as the mean ± SE (n = 6–13). Statistical analysis was performed using the one-way ANOVA with a post-hoc Dunnett’s multiple comparisons test. *p < 0.05. D. Images of pronephric uptake of Alexa 488-10 kDa dextran (green) in wild type (WT) or ocrl-/- embryos or WT or ocrl-/- embryos injected with 2 ng PIP5Kαb morpholino. The pronephric tubules are indicated with a green dashed line. E. Quantification of pronephric uptake of Alexa 488-10 kDa dextran in each of the indicated embryo types. F. Transverse confocal images showing megalin labelling in the proximal pronephric region of 72 hpf wild-type (WT), ocrl-/- or ocrl-/- embryos injected with 2 ng PIP5Kαb morpholino (top) and quantitation of megalin fluorescence (bottom). G. Transverse confocal images showing EEA1 labelling in the proximal pronephric region of 72 hpf wild-type (WT), ocrl-/- or ocrl-/- embryos injected with 2 ng PIP5Kαb morpholino. H. Block face scanning electron microscopy images of transverse sections through the proximal pronephric tubule of wild-type (WT), ocrl-/- or ocrl-/- embryos injected with 2 ng PIP5Kαb morpholino. The bottom row is a colour-coded version of the top row, with vacuaolar endosomes false coloured in green. I. Quantification of vacuolar endosome number, size and total area. Data in E, F and I are presented as the mean ± SEM. Statistical analysis was performed using the Pearson’s chi-squared test. ***p < 0.0001, **p < 0.001, *p < 0.01. Scale bars represent 10 µm (F, G) and 2 µm (H). EXPRESSION / LABELING:
PHENOTYPE:
|

Dextran uptake assay and colocalization with endosomes. A. Schematic representation of pronephric tubules (green) in 72hpf zebrafish embryos (left lateral view, top right dorsal view) (top) and pronephric uptake assay in 72hpf zebrafish embryos (bottom) showing embryos immediately after injecting Alexa 488-10 kDa dextran (10kDa-FD, green)(left) or after 2.5h incubation to allow accumulation in the pronephros (arrow) (right). B. Confocal transverse section of zebrafish proximal pronephric tubule of 72 hpf zebrafish embryos injected with Alexa 488-10 kDa dextran (green) and incubated for 2.5 h prior to fixation and labelling with antibodies to the early endosome marker EEA1 (red). Scale bar, 5 µm. |
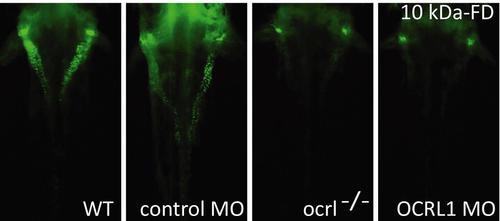
Impairment of pronephric uptake in OCRL1 deficient zebrafish embryos. Fluorescence dissecting microscopy of wild-type (WT), ocrl-/- mutant, control morphant or OCRL1 morphant 72 hpf zebrafish embryos that were injected with Alexa 488-conjugated 10 kDa dextran (green) and imaged after 2.5h. Dorsal view. |
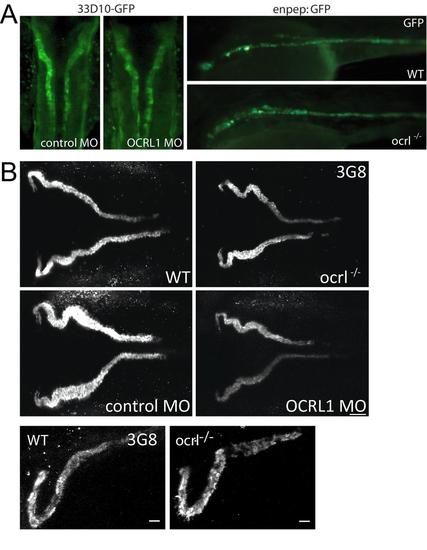
Pronephric tubule development in ocrl-/- embryos. A. Dorsal view of 33D10-GFP zebrafish embryos (72hpf) expressing GFP in the pronephric tubules injected with control or OCRL1 morpholino (MO) (left). Lateral view of wild type and ocrl-/- zebrafish embryos (72hpf) expressing enpep:GFP in the pronephric tubules (right). B. Confocal images of pronephric tubules of wild-type (WT), ocrl-/- mutant, control morphant or OCRL1 morphant 72 hpf zebrafish labelled with the 3G8 anti-brush border antibody (dorsal view). EXPRESSION / LABELING:
PHENOTYPE:
|
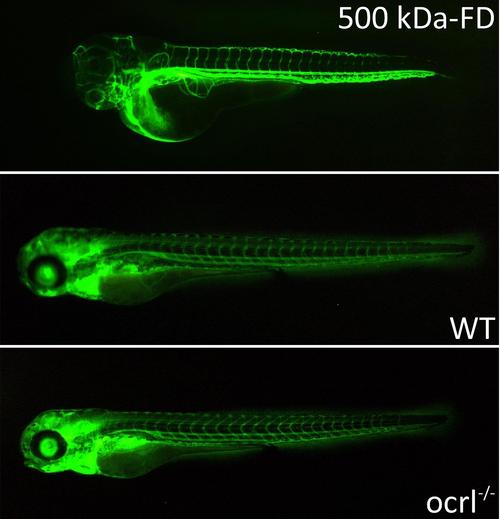
Pronephric filtration of 500 kDa-FD. A. Fluorescence dissecting microscope image of zebrafish embryos (72hpf) injected with 500 kDa dextran conjugated with FITC (500 kDa-FD) immediately after injection (top) and after 24h: wild type (middle) and ocrl-/- embryos (bottom) (96hpf). Retained 500 kDa-FD (green) is present in the vasculature of both embryo types. |
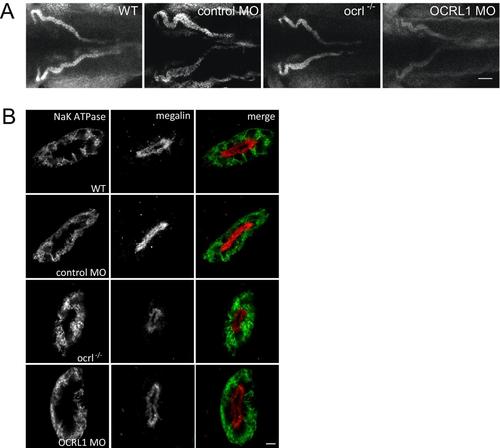
OCRL1 deficiency does not affect cell polarity. A. Confocal transverse sections of the zebrafish proximal pronephric tubule of 72 hpf wild-type (WT), ocrl-/- mutant, control morphant or OCRL1 morphant embryos labelled with anti-brush border (3G8, green) and anti-megalin (red) antibodies. B. Confocal transverse sections of the zebrafish proximal pronephric tubule of 72 hpf wild-type (WT), ocrl-/- mutant, control morphant or OCRL1 morphant larvae labelled with anti-NaK ATPase (green) and anti-megalin (red) antibodies. Scale bars represent 5 µm. EXPRESSION / LABELING:
|
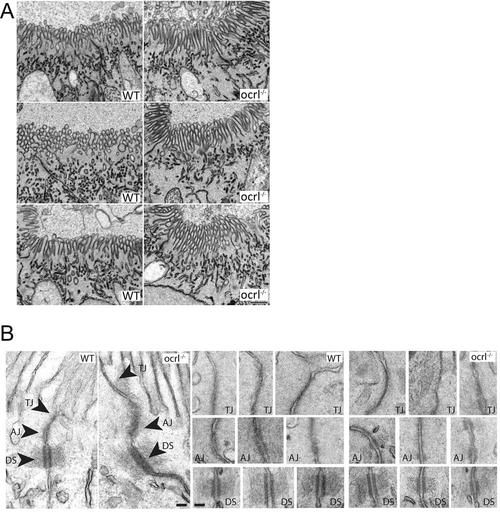
Brush border and intercellular junctions of ocrl-/- zebrafish pronephric cells. A. Block face scanning electron microscopy images of microvilli at the apical brush border of pronephric tubule cells of wild type and ocrl-/- embryos (72hpf). B. Transmission electron microscopy images of intercellular junctions between pronephric cells of wild type and ocrl-/- embryos (72hpf). AJ = adherent junctions, TJ = tight junctions, DS = desmosomes. Scale bars represent 0.5 µm (A) and 100 nm (B). |