
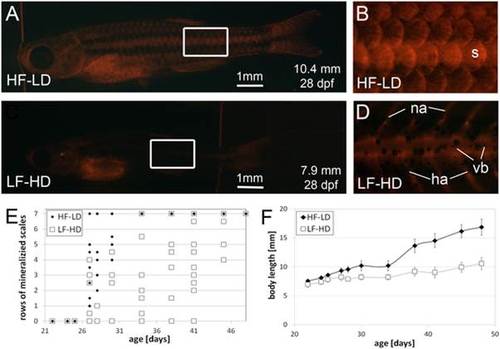
Hyperphagia results in increased linear growth and earlier scale formation A-D: Alizarin red staining of age-matched (28 dpf) juvenile fish (A,C) and corresponding magnification of the flank (B,D) of fish raised with high amounts of food at low density (A,B; HF-LD) and low amounts of food at high density (C,D; LF-HD). Body lengths of the shown individuals are indicated. Regions magnified in (B,D) are boxed in (A,C). E: Graph summarizing scale mineralization status (number of rows of mineralized scales) of analyzed fish at different ages. HF-LD fish started to display 7 rows of mineralized from an age of 27 days onwards, while it took LF-HD fish at least 34 days to reach this stage. F: Body length growth curves of sibling fish as in (A-E) shown as mean +/- standard deviation of 10 analyzed fish per condition and time point. LF-HD fish are significantly shorter than HF-LD fish. Similar results were obtained in a second, independent experiment. Abbreviations: ha, hemal arch; dpf, days post-fertilization; na, neural arch; s, scale; vb, vertebral body. PHENOTYPE:
|

ZFIN is incorporating published figure images and captions as part of an ongoing project. Figures from some publications have not yet been curated, or are not available for display because of copyright restrictions. |
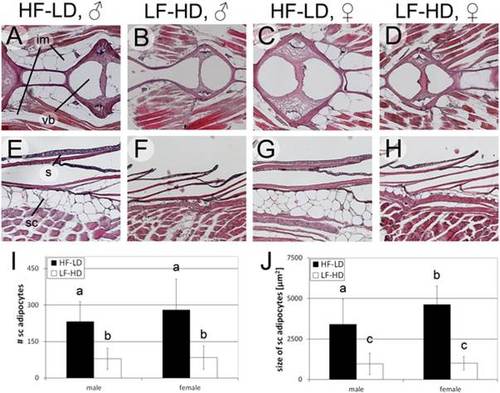
Hyperphagia results in hyperplastic and hypertrophic adipocytes in middle-aged fish. A-H: H&E staining of longitudinal sections of male (A,B,E,F) and female (C,D,G,H) HF-LD (A,C,E,G) and LF-HD (B,D,F,H) fish, 6.5 months of age, dorsoventral level 2 (compare with S4A Fig.); I-J: Average total numbers of subcutaneous adipocytes per level (I) and sizes (J) of subcutaneous adipocytes of male and female LF-HD and HF-LD fish (body length 28.8 +/- 0.9 mm (male HF-LD), 21.2 +/- 1.5 mm (male LF-HD), 31.1 +/- 1.4 mm (female HF-LD) and 20.8 +/- 1.4 mm (female LF-HD)) from 5 corresponding longitudinal levels along the dorsoventral axis (see S4C,D Fig.); columns with different superscript letters are significantly different (p<0.05) according to ANOVA followed by the Least Significant Difference (Bonferroni’s) test, n = 40 (2 fish per condition, 5 levels per fish, 2 sections per level and left and right sides per section). Similar experiments were obtained in an additional, independent experiment. Abbreviations: im, intermuscular adipocytes; s, scale; sc, subcutaneous adipocytes; vb, vertebral body. PHENOTYPE:
|
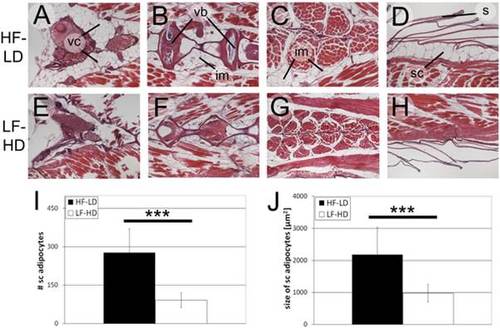
Aged (18 months old) male HF-LD and LF-HD fish display decreased adipocyte sizes but unaltered adipocyte numbers compared to middle-aged fish. A-H: H&E staining on longitudinal sections of male LF-HD (E-H) and HF-LD (A-D) fish showing visceral (A,E), subcutaneous (D,H) and intermuscular (B,C,F,G) adipocytes at dorsoventral levels 2 (A,B,D,E,F,H) or level 4 (C,G) (compare with S5A Fig.); I,J: Average total numbers of subcutaneous adipocytes per level (I) and sizes (J) of subcutaneous adipocytes of male LF-HD and HF-LD fish (body length 32.3 +/- 1.0 mm (male HF-LD), 22.5 +/- 1.0 mm (male LF-HD)) from 5 corresponding longitudinal levels along the dorsoventral axis (S5C,D Fig.); *** indicates significant differences (p<0.001) according to the Student`s T test, n = 40 (2 fish per condition, 5 levels per fish, 2 sections per level and left and right per section). Similar results were obtained in an additional, independent experiment. Abbreviations: im, intermuscular adipocytes; s, scale; sc, subcutaneous adipocytes; vb, vertebral body; vc, visceral adipocytes. PHENOTYPE:
|
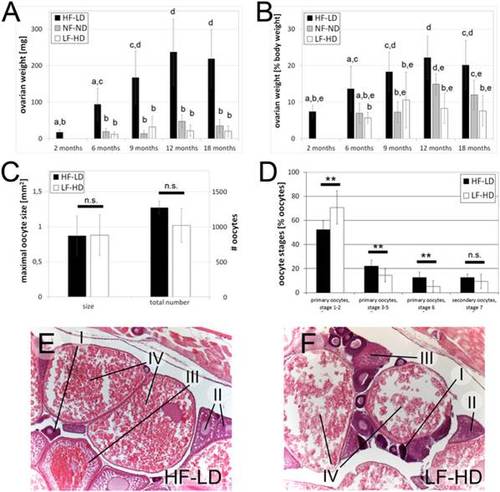
Hyperphagia leads to increased ovarian sizes and enhanced oocyte growth rates, while not affecting final oocyte sizes. A-B: Weight of ovaries of female LF-HD, NF-ND and HF-HD in mg (A) and in % total body weight (B) at different ages; at an age of 2 months, numbers could only be supplied for HF-LD females, since NF-ND and LF-HD fish of this age were not sexually mature as yet; columns with same superscript letter are not significantly different (p>0.05) according to ANOVA followed by the Least Significant Difference (Bonferroni’s) test, n e 5. C: Sizes of fully grown oocytes and total number of oocytes of female LF-HD and HF-LD fish were not significantly (n.s.) different according to the Student`s T test, n = 10 (10 biggest oocytes of all levels) or n = 3 (3 females). D: Relative numbers of oocytes per maturation stage of HF-LD and LF-HD females (in % of total oocyte numbers) in all of the four analyzed dorsoventral levels (compare with S6A Fig.); ** indicates significant differences (p<0.01), n.s. means not significant according to the Student`s T test, n = 3. E-F: H&E staining of longitudinal sections through ovaries of HF-LD (E) and LF-HD female (F), 8.5 months of age, dorsoventral level 2. I: primary oocyte, stage 1–2 (previtellogenic); II: primary oocyte, stage 3–5 (previtellogenic); III: primary oocyte, stage 6 (vitellogenic); IV: secondary oocyte (meiotic arrest), stage 7; staging was done as described [71,72]. Similar results were obtained in second, independent experiments. PHENOTYPE:
|
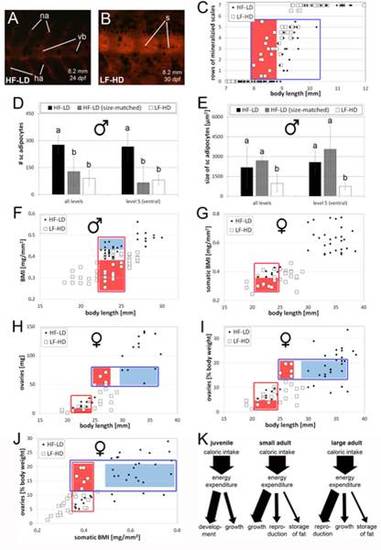
Caloric intake has differential effects on the timing of scale formation, somatic and ovarian growth and fat incorporation. A-B: Alizarin red staining of size-matched juvenile HF-LD (A) and LF-HD (B); body lengths and ages of the shown individuals are indicated. The flank of the LF-HD fish has several rows of mineralized scales, whereas no scales are visible in the corresponding region of the HF-LD fish. (C) Plot of rows of mineralized scales vs body length. (D,E) Comparison of numbers (D) and sizes (E) of subcutaneous adipocyte sizes (E) of 18 months old LF-HD males (white columns) with age-matched HF-LD male siblings (black column) and size-matched HF-LD males (striped columns; age: 2 months). Standard lengths of investigated fish were: HD-LD, 18 months: 32.3 +/- 1.0 mm; HF-LD, 2 months: 23.0 +/- 0,8 mm; LF-HD, 18 months; 22.5 +/- 1.0 mm. Left sides of each panel show average numbers from 5 corresponding longitudinal levels along the entire dorsoventral axis (for averages of single levels, see S7 Fig.), right sides show numbers for level 5 only (ventral). Columns with different superscript letter are significantly different (p<0.05) according to ANOVA followed by the Least Significant Difference (Bonferroni’s) test; n = 40 (2 fish per condition, 5 levels per fish, 2 sections per level and left and right side per section). F-J: Plots of BMI vs length of males (F); somatic BMI vs. length of females (G); absolute ovary weight vs. length (including 2 months HF females) (H); relative ovary weight vs. length (I); relative ovarian weight vs. somatic BMI (J). Crucial parameter intervals in (C, F-J) are boxed in red or blue, intervals only occupied by HF-LD fish are highlighted in blue, intervals only occupied by LF-HD fish in red. In (G-J), HF-LD females in regions boxed in red were 2 months of age, but already sexually mature. K: Schemes showing differential energy allocations to scale formation / postembryonic development, growth, reproduction and fat storage in juvenile, small and large adult fish. Abbreviations: ha, hemal arch; na, neural arch; s, scale; vb, vertebral body. |
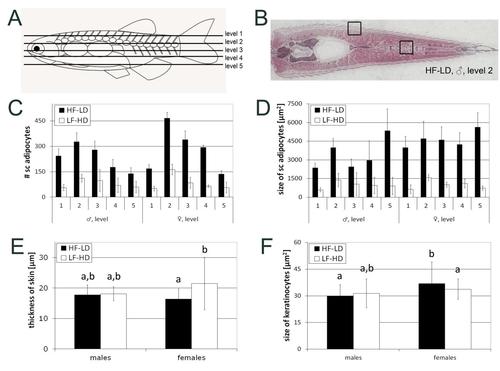
Obesity in 6.5 months old HF-LD fish is accompanied with differential and region-specific hyperplasia and hypertrophy of subcutaneous adipocytes, while keratinocytes are largely unaffected. A: Schematic overview of the different dorsoventral levels (1–5) at which longitudinal sections were used to analyze subcutaneous adipocytes; B: overview of an H&E stained section of a male HF-LD fish at level 2; boxes show locations of areas shown in Fig. 3 A-H. C,D: Numbers of subcutaneous adipocytes per level (C) and sizes (D) of subcutaneous adipocytes of male and female LF-HD and HF-LD fish in each of the 5 analyzed levels, n = 8 (2 fish per condition, 2 sections per level and 2 sides per section); E,F: Thickness of the skin (E) and sizes of keratinocytes (F) of male and female LF-HD and HF-LD fish, determined at the level of the most posterior scale for each level, means of all levels are shown; columns with same superscript letter are not significantly different (p>0.05) according to ANOVA followed by the Least Significant Difference (Bonferroni’s) test, n = 20 (for thickness, 2 fish per condition, 5 measurements per side of the analysed section) or n = 40 (for size, 2 fish per condition, 10 measured keratinocytes per side of the analysed section). Similar results were obtained in second, independent experiments. |
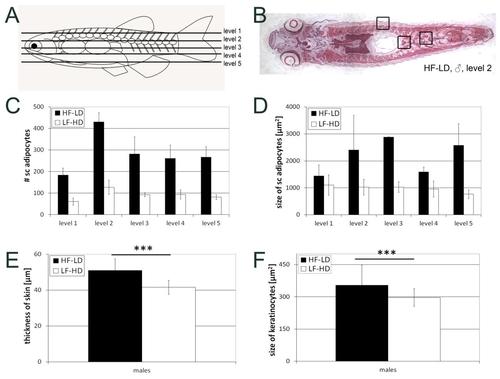
Reduction of BMI and TG levels in 18 months old male zebrafish is accompanied with a reduction in adipocyte sizes. A: Schematic overview of the different levels of which longitudinal sections were used to analyze subcutaneous adipocytes; B: overview of an H&E stained section of a male HF-LD fish at level 2, boxes show locations of the areas shown in Fig. 4 A-H; C-D: Numbers (C) and sizes (D) of subcutaneous adipocytes of male LF-HD and HF-LD fish with an age of 18 months shown for each of the 5 analyzed levels, n = 8 (2 fish per condition, 2 sections per level and 2 sides per section); E,F: Thickness of the skin (E) and sizes of keratinocytes (F) of male LF-HD and HF-LD fish, determined at the level of the most posterior scale for each level, means of all levels are shown; *** indicate significant difference with p<0.001 according to the Student`s T test, n = 20 (for thickness, 2 fish per condition, 5 measurements per side of the analysed section) or n = 40 (for size, 2 fish per condition, 10 measured keratinocytes per side of the analysed section). Similar results were obtained in second, independent experiments. |
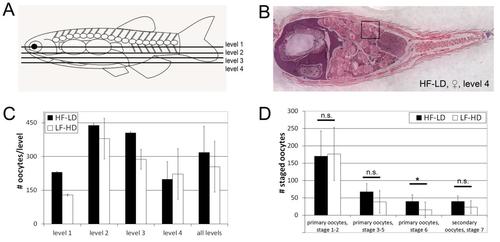
Caloric intake affects ovarian sizes and oocyte growth rates in in 8.5 months old females—additions to Fig. 5. A: Schematic overview of the different levels at which longitudinal sections were used to analyze oocytes. B: Overview of an H&E stained section of a female HF-LD fish at level 4; boxes show location of the area shown in Fig. 5E,F. C: Numbers of oocytes of LF-HD and HF-LD females in each of the 4 analyzed levels, n = 3 for level 1–4, n = 12 for all levels. D: Absolute numbers of oocytes per maturation stage of HF-LD and LF-HD females in all of the four analyzed dorsoventral levels; * indicates a significant difference (p<0.05), n.s.means not significant according to the Student`s T test, n = 3. Similar results were obtained in a second, independent experiment. |