
- Title
-
ETV2 expression increases the efficiency of primitive endothelial cell derivation from human embryonic stem cells
- Authors
- Lindgren, A.G., Veldman, M.B., Lin, S.
- Source
- Full text @ Cell Regen (Lond)
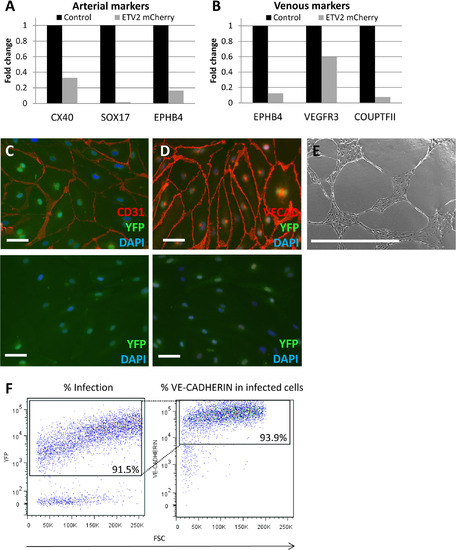
Characterization ofETV2-induced endothelial cells. (A,B) Semi-quantitative real-time PCR on sorted YFP+ VE-CADHERIN+ cells from day 7 of differentiation and infected in day 4 for arterial (A) and venous (B) markers. (C,D) Immunofluorescence against CD31 and VE-CADHERIN on sorted ETV2-mCherry-infected VE-CADHERIN-positive cells cultured for 7 days. Scale bar = 20 µm. Upper panels are anti-CD31 (C) or VE-CADHERIN (D) primary antibody and appropriate secondary. Lower panels, secondary antibody only. (E) Network formation on Matrigel of sorted ETV2-mCherry VE-CADHERIN positive cells grown for 7 days in culture. The cells were imaged 8 h after plating. Scale bar = 1 mm. (F) Flow cytometry on sorted ETV2-mCherry-infected VE-CADHERIN-positive cells cultured for 7 days. The cells were analyzed for YFP expression and VE-CADHERIN expression. Percentages are an average of two experiments. |