
- Title
-
Gata2b is a restricted early regulator of hemogenic endothelium in the zebrafish embryo
- Authors
- Butko, E., Distel, M., Pouget, C., Weijts, B., Kobayashi, I., Ng, K., Mosimann, C., Poulain, F.E., McPherson, A., Ni, C.W., Stachura, D.L., Del Cid, N., Espín-Palazón, R., Lawson, N.D., Dorsky, R., Clements, W.K., Traver, D.
- Source
- Full text @ Development
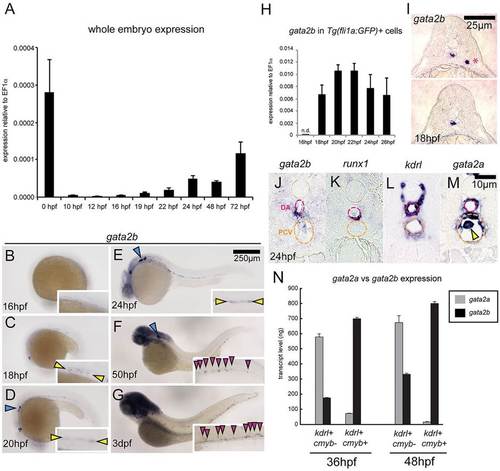
Zebrafish gata2b is expressed in hemogenic endothelium. (A) Expression of gata2b in whole embryos over time. cDNA isolated from 20-30 pooled embryos per timepoint. Error bars indicate s.e.m. of three biological samples. (B-G) Whole-mount in situ hybridization (WISH) of gata2b expression at the indicated stages. Yellow arrowheads indicate expression in the vascular cord region (C) and dorsal aorta (DA) (D,E). Blue arrowheads indicate branchiomotor neurons (D-F). Pink arrowheads indicate expression in the caudal hematopoietic tissue (CHT) (F,G). (H) qPCR of gata2b expression in GFP+ cells isolated from fli1a:GFP embryos by FACS. n.d., not detected. GFP+ cells sorted from 20-30 pooled embryos per timepoint. Error bars indicate s.e.m. of three technical replicates. (I) Transverse trunk sections showing WISH for gata2b at 18hpf. Top, rare cell detected outside the midline (asterisk). Bottom, representative section with gata2b+ cell localized to the midline. (J-M) Transverse sections showing WISH for gata2b (J), runx1 (K), kdrl (L) and gata2a (M) at 25hpf. Pink dashed ovals indicate the DA; orange dashed ovals indicate the posterior cardinal vein (PCV). Yellow arrowhead indicates a primitive erythrocyte. (N) Quantitation of gata2a and gata2b transcripts in kdrl+ cmyb and kdrl+ cmyb+ cells from 36hpf and 48hpf kdrl:mCherrymem;cmyb:GFP embryos. Cells isolated from 50-100 pooled embryos per sample. Two biological experiments were performed for each timepoint, with one representative shown. Error bars indicate s.e.m. of three technical replicates for each representative experiment. EXPRESSION / LABELING:
|
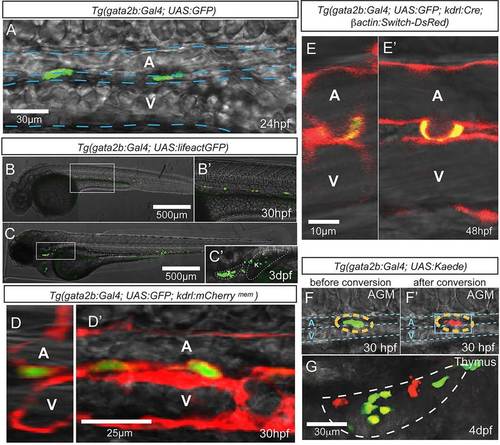
Tg(gata2b:Gal4) marks hemogenic endothelial cells. Imaging is by confocal microscopy. (A) GFP+ endothelial cells in the trunk region of a gata2b:Gal4;UAS:GFP embryo at 24hpf. (B-C′) gata2b:Gal4;UAS:lifeactGFP at 30hpf and 3dpf. (C′) An enlarged view of C, with thymus and kidney highlighted. (D,D′) Transverse (D) and lateral (D′) views of the trunk vasculature of 30hpf gata2b:Gal4;UAS:GFP;kdrl:mCherrymem. (E,E′) Transverse (E) and lateral (E′) views of a 48hpf gata2b:Gal4;UAS:GFP;kdrl:Cre;actB2:LoxP-STOP-LoxP-DsRedEx embryo showing a GFP+ cell undergoing EHT. (F,F′) A representative Kaede+ cell in the trunk of a gata2b:Gal4;UAS:Kaede embryo before (F) and after (F′) photoconversion. Blue dashed lines indicate the approximate location of DA and PCV. (G) Thymus of a 4dpf gata2b:Gal4;UAS:Kaede embryo that experienced photoconversion of a single aortic gata2b+ cell in the trunk at 46hpf. White dashed line highlights the thymus region. T, thymus; K, kidney; A, aorta; V, vein. |
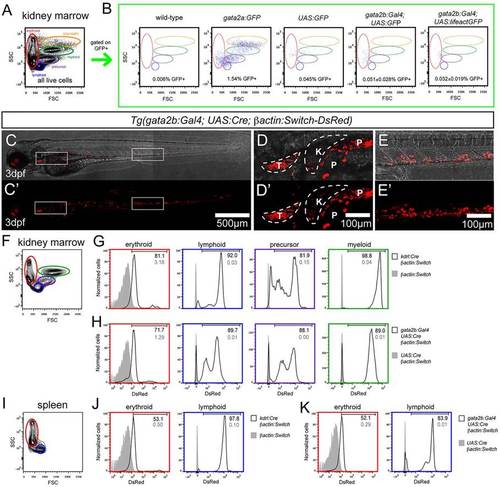
gata2b+ cells give rise to adult blood. (A,B) Analysis of GFP+ cells in the whole kidney marrow (WKM). (A) Representative flow cytometry analysis of the adult WKM, including the distribution of erythroid (red), lymphoid (blue), precursor (purple), myeloid (green) and eosinophil (orange) populations. (B) Percentage and distribution of GFP+ cells from the WKM of adult zebrafish of the indicated genotypes. Scatter plots depict the forward and side scatter distribution of GFP+ cells from the WKM, with populations marked as in A for reference. For wild type (n=1), gata2a:GFP (n=2) and UAS:GFP (n=2), the indicated percentage corresponds to the representative scatter plot. For gata2b:Gal4;UAS:GFP (n=3) and gata2b:Gal4;UAS:lifeactGFP (n=3), a representative scatter plot is shown and the indicated percentage of GFP+ cells corresponds to the average±s.d. (C-E′) gata2b:Gal4;UAS:Cre;βactin:Switch-DsRed embryo at 3dpf. (C,C′) DsRed fluorescence in the whole embryo. (D,D′) Enlarged view of thymus (T) and kidney (K) region from C,C&prime& P, pigment. (E,E′) Enlarged view of the CHT region from C,C′. (F) Representative flow cytometry analysis of adult WKM. (G) DsRed fluorescence of erythroid, lymphoid, precursor and myeloid fractions of WKM of βactin:Switch-DsRed (gray filled) and kdrl:Cre;βactin:Switch-DsRed (black line). (H) DsRed fluorescence of erythroid, lymphoid, precursor and myeloid fractions of WKM of UAS:Cre;βactin:Switch-DsRed (gray filled) and gata2b:Gal4;UAS:Cre;βactin:Switch-DsRed (black line). (I) Representative flow cytometry analysis of the adult spleen. (J) DsRed fluorescence of erythroid and lymphoid fractions of the spleen of βactin:Switch-DsRed (gray filled) and kdrl:Cre;βactin:Switch-DsRed (black line). (K) DsRed fluorescence of erythroid and lymphoid fractions of the spleen of UAS:Cre;βactin:Switch-DsRed (gray filled) and gata2b:Gal4;UAS:Cre;βactin:Switch-DsRed (black line). (G,H,J,K) Numbers indicate percentage of cells in the DsRed+ fraction. EXPRESSION / LABELING:
|
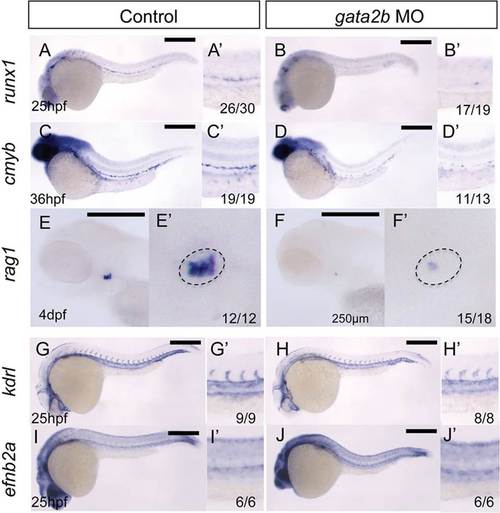
gata2b is required for the formation of HSCs. (A-J) WISH of the indicated genes in wild-type embryos and gata2b morphant siblings at the stages indicated. (A′,B′,C′,D′,G′,H′,I′,J′) Magnified views of the trunk region. (E′,F′) Magnified views of the thymus region (dashed ovals) of E,F. The number of embryos showing the illustrated phenotype among the total examined is indicated. Scale bars: 250µm. |

Notch and non-canonical Wnt signaling contribute to gata2b expression in hemogenic endothelium. (A-D) WISH of runx1 and gata2b expression in control and mib morphant siblings. (E-H) Expression of runx1 and gata2b in embryos treated with DMSO or the γ-Secretase inhibitor DBZ from 10 to 24hpf. (I-L) Expression of runx1 and gata2b in control and wnt16 morphant siblings. Scale bar: 250µm. EXPRESSION / LABELING:
|
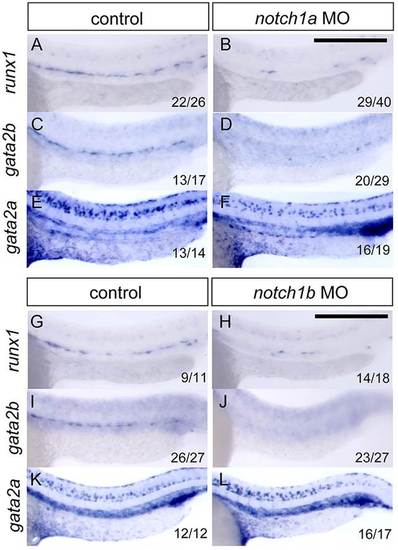
notch1a and notch1b are required for expression of gata2b, but not gata2a, within the endothelium. (A-F) Expression of runx1 (A,B), gata2b (C,D) and gata2a (E,F) in control and notch1a morphant siblings. (G-L) Expression of runx1 (G,H), gata2b (I,J) and gata2a (K,L) in control and notch1b morphant siblings. Scale bars: 250µm. EXPRESSION / LABELING:
|
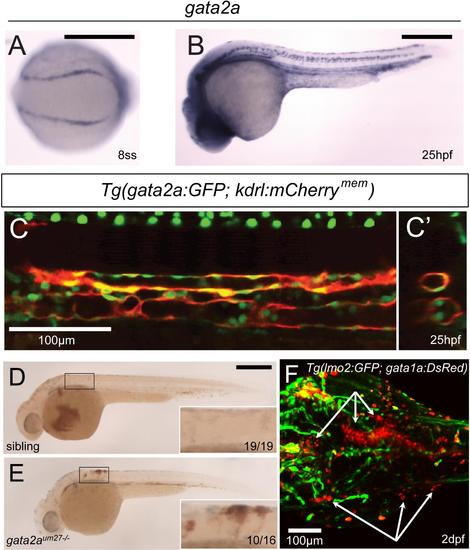
gata2a is expressed within the vasculature, and is required for vascular integrity. (A) In situ hybridization of gata2a expression in the PLM at the 8-somite stage (13 hpf) (B) Expression of gata2a at 25 hpf. (C) Confocal microscopy shows a lateral view of the trunk region of gata2a:GFP;kdrl:mCherrymem at 25 hpf. (C′) Digitally reconstructed transverse view of the trunk region in (C). (D-E) Pooling of red blood cells observed by o-dianisidine staining in 2 dpf siblings (D) and gata2aum27 mutants (E). (F) Confocal microscopy of the head vasculature and erythrocytes in a 2 dpf lmo2:GFP;gata1a:DsRed;gata2aum27-/- embryo. White arrows denote extravascular erythrocytes. EXPRESSION / LABELING:
PHENOTYPE:
|
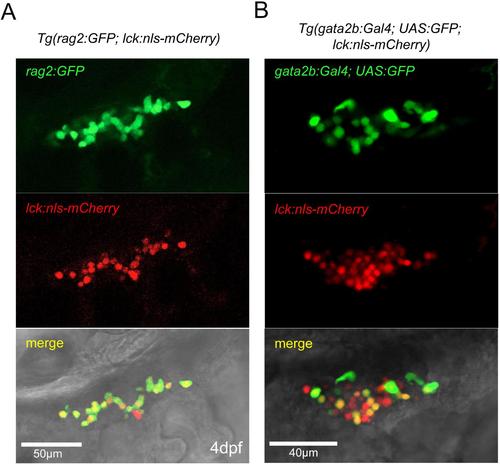
gata2b:Gal4 marks lymphoid cells in the thymus. (A-B) Confocal microscopy of the thymus region at 4 dpf. (A) The novel transgenic line lck:nlsmCherry labels rag2:GFP+ lymphoid cells. (B) gata2b:Gal4;UAS:GFP labels lck:nls:mCherry+ lymphoid cells. EXPRESSION / LABELING:
|
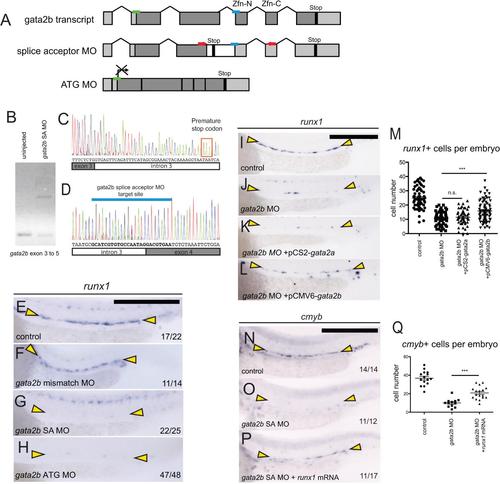
gata2b morpholino validation. (A) Schematic representation of gata2b morpholino targets. Light grey boxes indicate untranslated regions (UTRs). Zfn-N and Zfn-C indicate the location of the N- and C-terminal zinc finger domains. The gata2b splice acceptor morpholino, represented by a blue bar, targets the intron 3 / exon 4 boundary upstream of the zinc finger DNA binding domains. Red arrows indicate the positioning of primers designed to validate the splice acceptor morpholino. A gata2b ATG morpholino, represented in (A) by a green bar, is designed to block translation of gata2b transcript. (B) RT-PCR of gata2b in embryos injected with gata2b splice acceptor morpholino. Primers amplify transcript from exon 3 to 5. (C-D) Representative sequences of the splice product produced by the gata2b splice acceptor MO. (E-H) In situ hybridization of runx1. Yellow arrowheads highlight the DA region. Expression of runx1 is maintained in control embryos (E) and embryos injected with a gata2b mismatch morpholino (F), which is homologous to the gata2b splice acceptor MO with the exception of 5 mismatched nucleotides. (G) Embryos injected with gata2b splice acceptor morpholino. (H) Embryos injected with gata2b translation blocking morpholino. (I-M) Attempted rescue of runx1 in gata2b morphants with provision of gata2a or gata2b. Expression of runx1 in control embryos (I), gata2b morphants (J), gata2b morphants injected with pCS2-gata2a-2A-tdTomato plasmid (K) and gata2b morphants injected with pCMV6-gata2b plasmid (L). Yellow arrowheads highlight the DA region. (M) Quantification of runx1+ cells in the DA in (I-L). n.s., not significant (p>0.05). ***, significant (p<0.0001). P-values calculated by unpaired, two-tailed Student’s T-test. Each data point represents one embryo. (N-P) runx1 partially rescues cmyb expression in gata2b morphants. In situ hybridization of cmyb at 30 hpf in control embryos (N), gata2b morphant siblings (O), and siblings coinjected with gata2b morpholino and runx1 mRNA. (Q) Quantification of cmyb+ cells in the DA in (N-P). Each data point represents one embryo. ***, significant (p<0.0001) by unpaired, two-tailed Student’s T-test. |
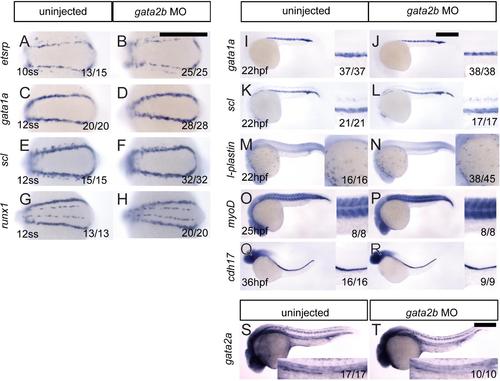
gata2b morphants have normal primitive hematopoiesis, morphogenesis, and gata2a expression. (A-R) Whole mount in situ hybridization of wildtype embryos and gata2b morphant siblings. Expression of etsrp at 10 ss (A, B). (C-H) Expression of gata1a (C, D), scl (E, F), and runx1 (G, H) in 12 ss embryos. (I-N) Expression of gata1a (I,J), scl (K, L) and l-plastin (M, N) in 22 hpf embryos. (O, P) Expression of myod in 25 hpf embryos. (Q, R) Expression of cdh17 in 36 hpf embryos. (S, T) Expression of gata2a in 25 hpf control (S) and gata2b morphant embryos (T). EXPRESSION / LABELING:
PHENOTYPE:
|