
- Title
-
Evolutionarily conserved regulation of hypocretin neuron specification by Lhx9
- Authors
- Liu, J., Merkle, F.T., Gandhi, A.V., Gagnon, J.A., Woods, I.G., Chiu, C.N., Shimogori, T., Schier, A.F., Prober, D.A.
- Source
- Full text @ Development
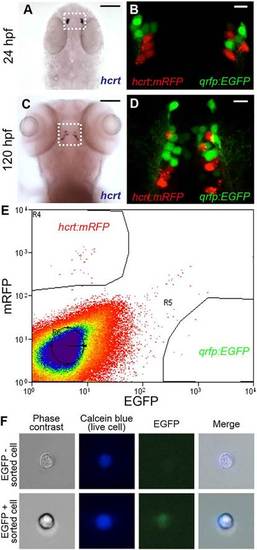
Isolation of hcrt- and qrfp-expressing neurons from zebrafish embryos. (A-D) hcrt is expressed in bilateral populations of 4-6 neurons at 24hpf (A) and 10-15 neurons at 120hpf (C). Fluorescence in Tg(hcrt:mRFP, qrfp:EGFP) embryos is first observed at <24hpf. mRFP- and EGFP-labeled neurons are intermingled, but the markers are never co-expressed in the same cell (B,D). Boxed regions in A,C are shown at higher magnification in B,D. Scale bars: 100µm in A,C; 10µm in B,D. (E) Tg(hcrt:mRFP, qrfp:EGFP) embryos were dissociated into single cells at 26hpf and mRFP- and EGFP-expressing cells were isolated by FACS. The proportion of mRFP-positive and EGFP-positive cells was consistent with the number of Hcrt and QRFP neurons, respectively, in a 26hpf embryo. (F) EGFP is observed in a sorted qrfp:EGFP+ cell. |
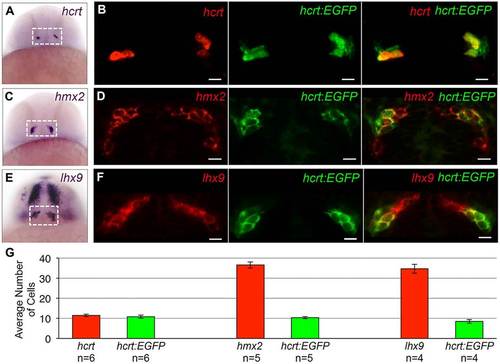
Examples of expression patterns of Hcrt neuron-enriched genes. (A,C,E) ISH performed on 24hpf zebrafish embryos using probes specific for hcrt, hmx2 and lhx9. Dashed boxes indicate the hypothalamic regions shown in B,D,F. (B,D,F) A 1.25-µm confocal section of fluorescent ISH (red) and hcrt:EGFP immunofluorescence (green). All hcrt:EGFP neurons express hmx2 and lhx9. hmx2 expression extends ventrally (C,D) and lhx9 is expressed in broader domains of the telencephalon and diencephalon (E,F), as well as the hindbrain and spinal cord (not shown). Supplementary material Movie 1 contains the complete confocal image stack for F. (G) Mean±s.e.m. number of cells in the boxed regions in A,C,E. n, number of brains. Scale bars: 10µm. EXPRESSION / LABELING:
|

Transient lhx9 overexpression induces ectopic Hcrt neurons. (A) Zebrafish embryos were injected with tol2 transposase mRNA and a plasmid in which a heat shock-inducible promoter regulates the expression of a candidate gene (hs:gene x). (B,C) Anterior views of 26hpf embryos after ISH showing endogenous hcrt expression (B) and mosaic expression of gene x 1 h after heat shock (C). Approximately 10-20% of cells overexpress gene x. White box in B,C indicates the hypothalamus. (D) Control embryos injected with an hs:EGFP plasmid exhibit normal hcrt expression at 120hpf. (E) Embryos overexpressing lhx9 contain ectopic Hcrt cells that are dorsal and caudal relative to endogenous Hcrt neurons. (F) Ectopic Hcrt cells exhibit neuronal morphology, as visualized using Tg(hcrt:EGFP) larvae. White and yellow boxes in D-F indicate endogenous and ectopic Hcrt cells, respectively. |
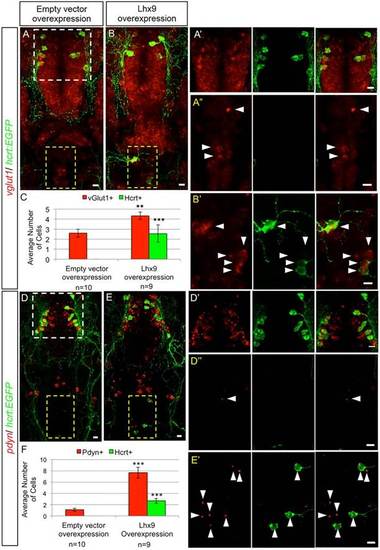
Hypothalamic and ectopic Hcrt neurons share biomarkers. Confocal projections of 120hpf Tg(hcrt:EGFP) zebrafish larval brains containing endogenous and ectopic Hcrt neurons labeled with an anti-EGFP antibody and fluorescent ISH probes specific for vglut1 (A,B) and pdyn (D,E). White and yellow boxes in A,D indicate endogenous Hcrt neurons in the hypothalamus and endogenous vglut1 and pdyn expression in the hindbrain, respectively, shown enlarged in A′,D′ and in A′′,D′′. Yellow boxes in B,E indicate ectopic Hcrt neurons, as enlarged in B′,E′. All hypothalamic and ectopic Hcrt neurons express vglut1 and pdyn. Larvae injected with hs:lhx9 and heat-shocked at 24hpf contain ectopic Hcrt neurons in the hindbrain and more cells with strong vglut1 (B,B′) and punctate pdyn (E,E′) expression, compared with controls injected with an empty heat shock vector (A,A′′,D,D′′). Arrowheads indicate cells with strong vglut1 or pdyn expression. (C,F) Mean±s.e.m. number of cells in the yellow boxed regions. n, number of brains quantified. **P<0.01, ***P<0.001 compared with empty heat shock vector (Student′s t-test). Scale bars: 10µm. EXPRESSION / LABELING:
|

Ectopic Hcrt neurons project to the locus coeruleus. (A) Confocal projection of a 120hpf Tg(hcrt:Kaede, dbh:EGFP) larva injected with an hs:lhx9 plasmid shows that ectopic photoconverted Hcrt cells in the medial hindbrain (red) project to the locus coeruleus (LC). (B) Confocal projection of a 120hpf Tg(dbh:EGFP) larva injected with an elavl3:Kaede plasmid to stochastically label neurons shows that some neurons in the medial hindbrain project to the LC (arrowhead) whereas others do not (arrow; axon projects orthogonally to the image). (C) All ectopic Hcrt neurons project to the LC, but only 20% of elavl3:Kaede-labeled cells in the same brain region project to the LC. n, number of neurons analyzed. ***P<0.001 compared with elavl3:Kaede (Fisher′s exact test). Yellow boxes in A,B indicate the regions used for quantification. (D) Schematic of hcrt, pdyn and vglut1 expression in the ventral zebrafish brain at 120 hpf. The locations of ectopic Hcrt neurons, dbh-expressing LC neurons and the photoconverted region are shown. Scale bars: 10µm. |
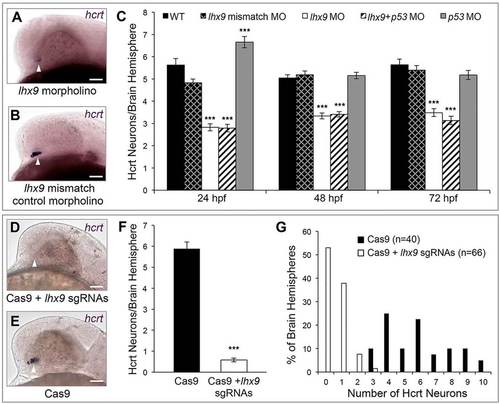
Lhx9 is required for Hcrt neuron specification. (A-C) hcrt ISH at 24hpf shows that morpholino-mediated knockdown of lhx9 reduces the number of Hcrt neurons and the level of hcrt expression (A) compared with embryos injected with a control morpholino (B). (C) Quantification of Hcrt neurons per brain hemisphere at 24, 48 and 72hpf revealed that lhx9 morphants have ~40% fewer Hcrt neurons. Co-injecting a p53 morpholino did not affect this phenotype. Mean±s.e.m. is shown. At least 22 embryos were quantified for each condition. ***P<0.001 compared with control morpholino (one-way ANOVA followed by Bonferroni′s correction for multiple comparisons). (D-G) hcrt ISH at 24hpf shows that co-injection of Cas9 protein and ten lhx9 sgRNAs eliminates hcrt expression (D) compared with embryos injected with Cas9 alone (E). (F) Quantification of Hcrt neurons per brain hemisphere at 24hpf. Mean±s.e.m. is shown. ***P<0.001 compared with Cas9 alone (one-way ANOVA). (G) The percentage of brain hemispheres containing the indicated number of Hcrt neurons. n, number of brain hemispheres analyzed in F,G. Arrowheads indicate endogenous Hcrt neuron region. Scale bars: 50µm. |
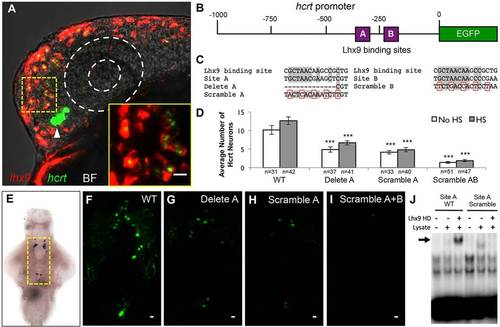
Lhx9 can directly induce hcrt expression. (A) Ectopic lhx9-expressing neurons also express hcrt in embryos injected with an hs:lhx9 plasmid, fixed 1 h after heat shock at 24hpf, and analyzed using double fluorescent ISH with hcrt-specific and lhx9-specific probes. Arrowhead indicates endogenous Hcrt neurons. A single 1.5µm confocal section is shown. Supplementary material Movie 4 contains the complete confocal image stack. The bright field (BF) overlay and dashed white circles show the position of the eye. The boxed region is shown at higher magnification in the inset. (B) Schematic of the zebrafish 1kb hcrt promoter, including putative Lhx9 binding sites A and B. (C) Sequence of a previously characterized mammalian Lhx9 binding site compared with sites A and B in the zebrafish hcrt promoter and in mutated constructs. Gray shading, dashes and red boxes indicate conserved nucleotides, deleted nucleotides and mutated nucleotides, respectively. (D-I) Embryos were injected with a plasmid containing both hcrt:EGFP and hs:lhx9, and some injected embryos were heat-shocked at 24hpf. Deletion or scrambling of putative Lhx9 binding sites reduced the number (D,F-I) and intensity (F-I) of EGFP-expressing cells. Cell counts indicate Hcrt cells per brain with (endogenous and ectopic Hcrt cells) and without (endogenous Hcrt cells only) heat shock. Mean±s.e.m. is shown. n, number of brains analyzed. ***P<0.001 compared with the wild-type promoter (one-way ANOVA followed by Bonferroni′s correction for multiple comparisons). (E) Yellow box indicates area shown in F-I. (J) EMSA showing that the Lhx9 homeodomain (HD) binds to the wild-type (WT) site A (arrow), but not the scrambled site A, in vitro. Scale bars: 10µm. |
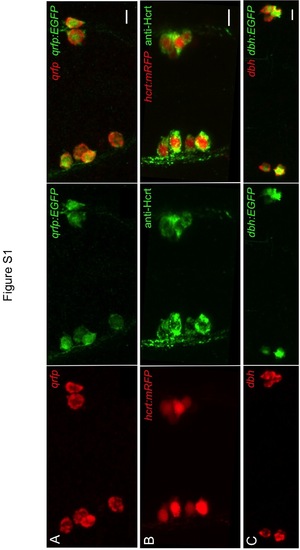
Validation of zebrafish QRFP, Hcrt, and DBH transgenic reporter lines. All cells labeled by fluorescent ISH for qrfp and dbh are also labeled by anti-GFP immunostaining in Tg(qrfp:EGFP, hcrt:mRFP) embryos at 24 hpf (A) and Tg(dbh:EGFP) larvae at 120 hpf (C). All mRFP expressing cells in 24 hpf Tg(qrfp:EGFP, hcrt:mRFP) embryos are labeled by anti-Hcrt immunostaining (B). Anterior (A,B) and dorsal (C) views are shown. Scale = 10 µm. |
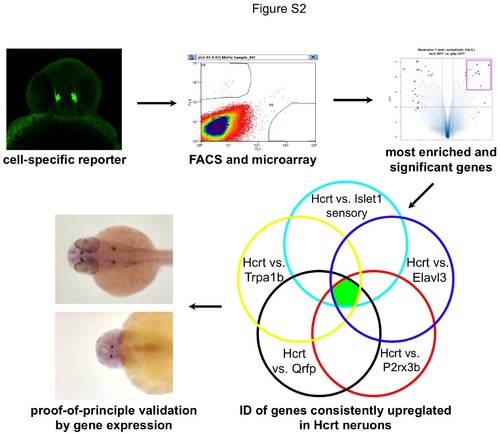
Strategy to identify genes enriched in embryonic zebrafish Hcrt neurons. Transgenic zebrafish embryos were dissociated into single cells at 26 hpf and cells of interest were purified by FACS. RNA from purified neurons was amplified and hybridized to microarrays. Signals from Hcrt neurons were compared to other neuron types and genes most highly enriched in Hcrt neurons were identified. Highly enriched transcription factors and secreted peptides were selected for verification by ISH and overexpression analysis in zebrafish. |
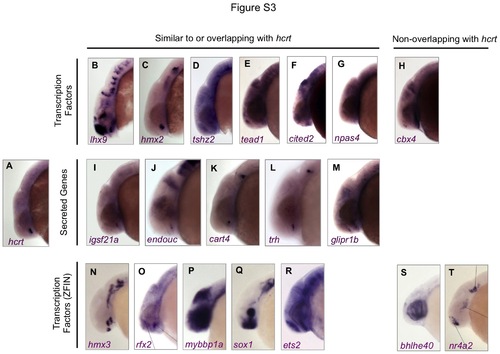
Expression patterns of genes identified as enriched in Hcrt neurons. ISH was performed using wild-type zebrafish embryos at 24 hpf. Anterior is left. Most candidate genes are expressed in a domain that is similar to, or overlaps with, the hcrt expression domain. Images in the bottom row were obtained from the ZFIN ISH database (Liu and Patient, 2008; Thisse et al., 2004). |
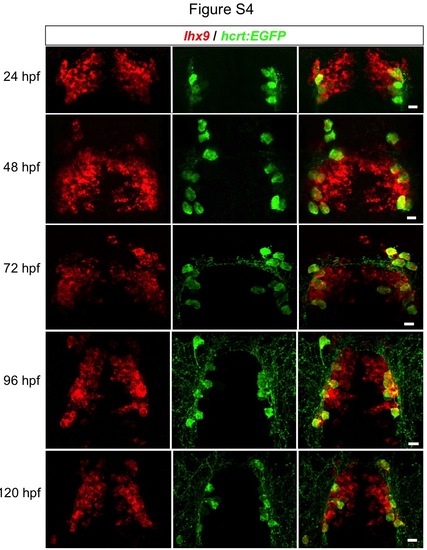
Time course of endogenous hcrt and lhx9 expression. Confocal projections of Tg(hcrt:EGFP) embryos at 24, 48, 72, 96, and 120 hpf show that all Hcrt cells express lhx9 throughout development, as determined by fluorescent ISH for lhx9 followed by anti-GFP immunostaining. Ventral images are shown. Scale = 10 µm. |
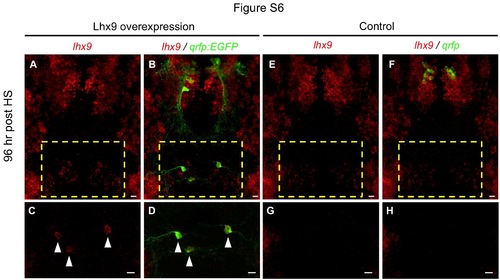
lhx9 overexpression induces ectopic QRFP neurons. (A-D) Ectopic qrfp:EGFP expressing neurons that persist until 96 hours post HS (120 hpf) also express ectopic lhx9 (arrowheads in C, D). (E-H) Double fluorescent ISH for lhx9 and qrfp in WT 120 hpf larvae shows an absence of lhx9 expression in the hindbrain region that contains lhx9-induced ectopic qrfp neurons in (A-D). Boxed regions in (A, B, E, F) are shown at higher magnification in (C, D, G, H). (A, B, E, F) show 95 µm thick confocal maximum intensity projections containing both endogenous and ectopic QRFP neurons. (C, D, G, H) show 43 µm thick confocal maximum intensity projections including only the region containing ectopic QRFP neurons. lhx9-expressing neurons that appear close to ectopic QRFP neurons in (B) are located 30 µm ventral to the ectopic QRFP neurons, and are thus not observed in (D). Scale = 10 µm. |
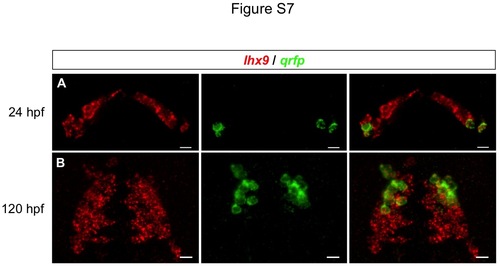
Expression of endogenous qrfp and lhx9. Confocal projections of WT embryos at 24 and 120 hpf show that all qrfp-expressing cells express lhx9, as determined by double fluorescent ISH. Ventral images are shown. Scale = 10 µm. |

Hcrt neurons do not express vglut2a at 120 hpf. Confocal projections of a 120 hpf Tg(vglut2a:mRFP, hcrt:EGFP) larva shows that vglut2a cells labeled with mRFP do not colocalize with endogenous (A) or ectopic (C) Hcrt neurons labeled with EGFP. The regions shown in (A) and (C) are indicated with dashed boxes in (B) and (D), respectively. Scale = 10 µm. |
|
Few or no Hcrt neurons express vglut2b at 120 hpf. Confocal projections of a 120 hpf Tg(hcrt:EGFP) larva shows that most Hcrt neurons immunostained with a GFP-specific antibody do not co-localize with vglut2b-expressing cells labeled by fluorescent ISH. Weak co-labeling was occasionally observed in endogenous and ectopic Hcrt neurons (white arrowheads). The approximate regions shown in (A) and (C) are indicated with dashed boxes in (B) and (D), respectively. Scale = 10 µm. |
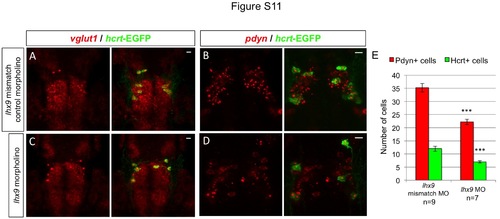
Endogenous hcrt- and pdyn-expressing neurons are reduced in lhx9 morphants. Tg(hcrt:EGFP) embryos injected with either lhx9 morpholino (C, D) or lhx9 mismatch control morpholino (A, B) were fixed at 72 hpf and probed for vglut1 or pdyn expression by fluorescent ISH. No obvious defects in vglut1 expression were observed in lhx9 morphants, but the total number of cells with intense, punctate pdyn expression was reduced by approximately 40% (E). This result suggests that the morpholino-induced reduction in Hcrt neurons is caused by cell loss, rather than silencing of hcrt expression. n indicates number of morphant brains analyzed. ***, p<0.001 compared to embryos injected with the control morpholino by Student’s t-test. Scale = 10 µm. |
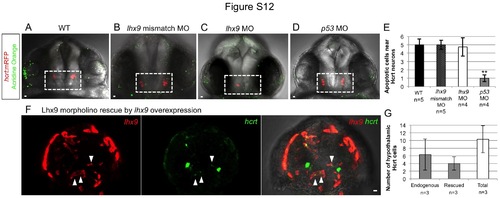
The lhx9 morpholino does not induce apoptosis and can be rescued by lhx9 overexpression. Tg(hcrt:mRFP) embryos were stained with acridine orange at 24 hpf to quantify apoptotic cells (A-D). There was no increase in apoptosis in embryos injected with lhx9 morpholino (C) compared to embryos injected with the lhx9 mismatch control morpholino (B) or wild-type embryos (A), suggesting that the reduced number of Hcrt neurons in lhx9 morphants is not due to apoptosis. Acridine orange labeled fewer cells in embryos injected with the p53 morpholino (D), presumably because apoptosis that normally occurs during development was suppressed. (E) Mean ± s.e.m. number of apoptotic cells in the white boxed region. At least 4 embryo brains were analyzed for each condition. **, p<0.01 compared to WT by one-way ANOVA followed by Bonferroni’s correction for multiple comparisons. (F) To rescue the morpholino phenotype, Tg(hcrt:EGFP) embryos were co-injected with the lhx9 morpholino and the hs:lhx9 plasmid. Following heat shock at 24 hpf, lhx9-overexpressing cells located in the endogenous hcrt expression domain also expressed hcrt (white arrowheads), indicating that lhx9 overexpression can rescue the lhx9 morpholino phenotype. (G) Mean ± s.e.m. number of endogenous and rescued hcrt cells per brain. Following rescue, the total number of hcrt-expressing cells is similar to the number observed in wild-type embryo brains (see Fig. 2G). hcrt expression in rescued cells was weaker than in endogenous Hcrt neurons, presumably because the rescued cells only received a pulse of lhx9 while endogenous Hcrt neurons continuously express lhx9. Three embryo brains with ectopic lhx9 expression in the endogenous Hcrt region were quantified. Anterior views of 26 hpf embryos are shown. Scale = 10 µm. |
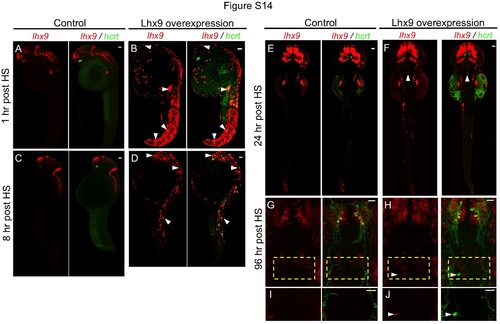
Time course of lhx9 and hcrt expression after heat shock. Double fluorescent ISH for lhx9 and hcrt are shown at 1 hour, 8 hours, and 24 hours after heat shock (HS)-induced lhx9 overexpression. Fluorescent ISH for lhx9 and immunostained hcrt:EGFP is shown at 96 hours post HS. (B) At 1 hour post HS, widespread lhx9 mRNA is detected throughout the embryo. Nearly all lhx9-expressing cells also express hcrt. (D) At 8 hours post HS, the number of cells with lhx9 overexpression and ectopic hcrt expression is reduced by approximately four-fold. Most lhx9-expressing cells still express hcrt. (F) At 24 hours post HS, little ectopic lhx9 or hcrt expression is observed, except for ectopic lhx9- and hcrt-co-expressing neurons in the medial hindbrain. Ectopic hcrt-expressing neurons that persist until 96 hours post HS (120 hpf) also express ectopic lhx9 (H, J). In contrast, control embryos injected with empty heat shock vector only exhibit hcrt expression in the hypothalamus (A, C, E, G, I). Arrowheads indicate examples of ectopic lhx9 and hcrt co-expression. (G, H) show 91 µm thick confocal maximum intensity projections containing both endogenous and ectopic Hcrt neurons. (I, J) show 45 µm thick confocal maximum intensity projections including only the region containing ectopic Hcrt neurons. lhx9-expressing neurons that appear close to ectopic Hcrt neurons in (H) are located 30 µm ventral to the ectopic Hcrt neurons, and are thus not observed in (J). Embryos fixed at 1 hour and 8 hours post HS are shown in side view. Embryos fixed at 24 hours and 96 hours post HS are shown dorsally and ventrally, respectively. Boxed regions in (G, H) are shown at higher magnification in (I, J). Scale indicates 50 µm (A-F) and 10 µm (G-J). |