
- Title
-
Tbx6, Mesp-b and Ripply1 regulate the onset of skeletal myogenesis in zebrafish
- Authors
- Windner, S.E., Doris, R.A., Ferguson, C.M., Nelson, A.C., Valentin, G., Tan, H., Oates, A.C., Wardle, F.C., Devoto, S.H.
- Source
- Full text @ Development
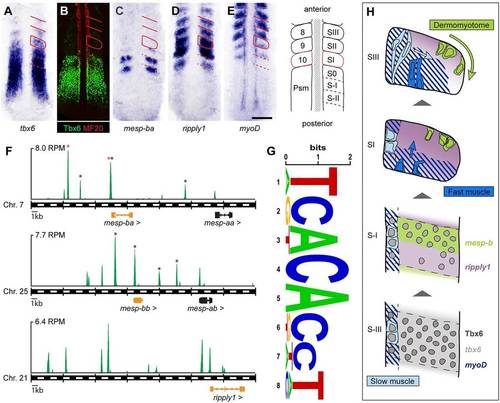
Tbx6 induces mesp-b paralogs and ripply1 before the onset of myogenesis in lateral paraxial mesoderm. (A-E) Labeling for tbx6, mesp-ba, ripply1 and myoD mRNAs, and for Tbx6 and myosin heavy chain (MF20) proteins at the 10-somite stage. Unbroken lines indicate most recently formed somites (SI-SIII); dashed lines indicate future somites (S0, S-I, S-II) in the anterior pre-somitic mesoderm (PSM). Scale bar: 100µm. (F) Anti-Myc immunoprecipitation from Tg(hsp70l:tbx6myc) embryos 1h after heat shock and subsequent sequencing reveals Tbx6Myc genomic binding proximal to mesp-ba, mesp-bb and ripply1. Shown are 35-kb windows encompassing significant peaks in reads per million (RPM) (supplementary material Table S1). Black asterisks indicate correspondence with T-box binding sites identified by Cutty et al. (2012). Red asterisks indicate peaks confirmed by ChIP-PCR (supplementary material Fig. S2). (G) Top sequence motif found in Tbx6Myc binding peaks (supplementary material Table S2). (H) Schematic showing spatial and temporal correlation of tbx6, mesp-ba and ripply1 expression with the onset of dermomyotome and myotome (slow and fast fiber) development (adapted from Stellabotte and Devoto, 2007). EXPRESSION / LABELING:
|
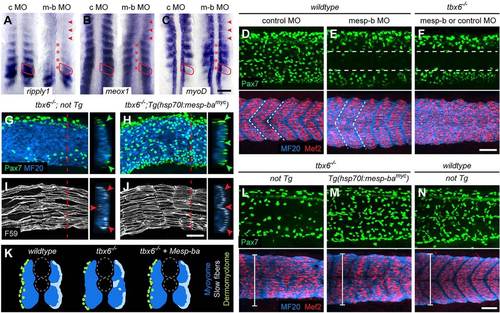
Mesp-b knockdown recapitulates and Mesp-baMyc expression rescues dermomyotome phenotype in tbx6 mutants. (A-F) Control and Mesp-b ATG MO-injected embryos at the 12-somite (A-C) and 24-h (D-F) stage. (A) ripply1, (B) meox1 and (C) myoD mRNA expression. Red asterisks indicate most recently formed somites; SI is outlined; red arrowheads indicate downregulation of all three genes in maturing somites. (D-F) Immunolabeling showing dermomyotome (Pax7, green) and corresponding myotome (MF20, blue; Mef2, red). Mesp-b morphants phenocopy tbx6 mutant dermomyotome but form somites similar to wild type; Mesp-b knockdown has no effect in tbx6 mutants. Dashed lines indicate central dermomyotome domain (top) and somite boundaries (bottom). (G-J,L-N) Non-transgenic and Tg(hsp70l:mesp-bamyc) tbx6 mutants heat-shocked at the 12-somite stage. (G-J) Transgenic embryos show increase in Pax7+ dermomyotome cells (G,H) and rescued patterning of slow muscle fibers (F59, gray) within the myotome (MF20, blue) (I,J). (K) Schematic illustrating rescue of tbx6 mutant phenotypes by transient Mesp-baMyc expression. (L-N) Transgenics develop larger myotomes (brackets), and show partially rescued myotome boundaries, similar to wild type. Scale bars: 100µm in C; 50µm in F,J,N. EXPRESSION / LABELING:
PHENOTYPE:
|
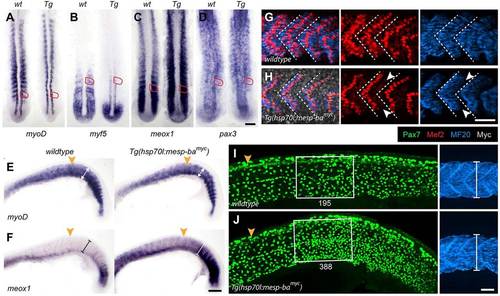
Mesp-baMyc inhibits fast fiber differentiation and promotes dermomyotome development. Tg(hsp70l:mesp-bamyc) embryos and wild-type siblings 1h (A-D), 6h (24-somite stage) (E-H) and 9h (24-h stage) (I,J) after the end of heat shock. (A-D) Transgenic embryos show downregulation of myoD (A) and myf5 mRNA (B) in the lateral paraxial mesoderm, and upregulation of meox1 (C), but no difference in pax3 (D). Most recently formed somite SI is outlined. (E,F) myoD expression shows smaller myotomes (E, brackets) in somites formed after heat shock (orange arrowhead); meox1 mRNA is upregulated throughout those somites (F, brackets). (G,H) In transgenic embryos (Myc+, gray), the number of slow muscle nuclei (Mef2, bright red) is similar to wild type, but fast fiber nuclei (Mef2, faint red) and myosin heavy chain protein (MF20, blue) are reduced (arrowheads). (I,J) Immunolabeling shows increase in Pax7+ dermomyotome cells (green) in Tg(hsp70l:mesp-bamyc) embryos (number indicated); boxed areas show underlying myotomes (MF20, blue) on the right. Orange arrowheads mark last somite formed before heat shock. Scale bars: 100µm in D,F; 50µm in H,J. EXPRESSION / LABELING:
PHENOTYPE:
|
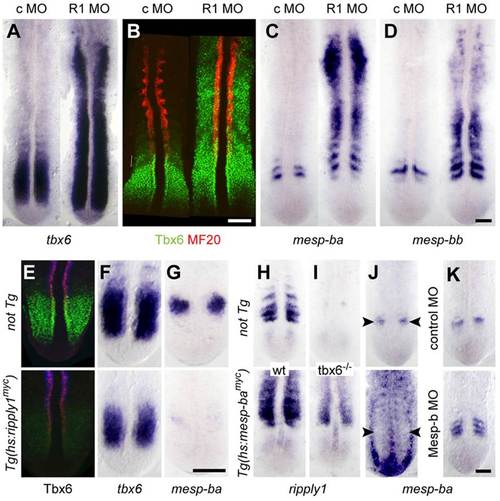
Ripply1 terminates tbx6 and mesp-b expression in the pre-somitic mesoderm. (A-D) Control and Ripply1 MO-injected embryos at the 12-somite stage labeled for tbx6 (A, mRNA; B, protein), and mesp-ba (C) and mesp-bb mRNA (D). All markers are upregulated in the absence of Ripply1. MF20 (B, red) labels slow muscle progenitors. (E-G) Tg(hsp70l:ripply1myc) embryos and non-transgenic sibling 0.5h (E) and 1h (F,G) post heat shock. Transgenics lose expression of Tbx6 protein (E) and mesp-ba mRNA (G), tbx6 mRNA is only slightly reduced (F). (H-J) Tg(hsp70l:mesp-bamyc) embryos and non-transgenic siblings 1h post heat shock. Ubiquitous expression of Mesp-ba leads to upregulation of ripply1 mRNA in wild type and tbx6 mutants (H,I). mesp-ba mRNA is not ubiquitously upregulated after Tg(hsp70l:mesp-bamyc): levels are low in the paraxial mesoderm, endogenous mesp-ba expression (arrowheads) is downregulated (J). (K) Control and Mesp-b MO-injected embryos labeled for mesp-ba mRNA. Scale bars: 100µm. EXPRESSION / LABELING:
PHENOTYPE:
|
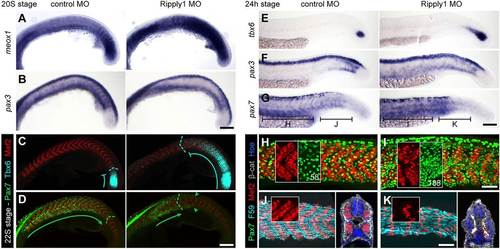
Ripply1 knockdown inhibits fast muscle development, dermomyotome maturation is delayed. Control and Ripply1 morphants at the 20-somite (A,B), 22-somite (C,D) and 24-h stage (E-K). (A,B) Ripply1 morphants show upregulation of meox1 (A) and downregulation of pax3 (B) mRNA. (C,D) In control embryos, Tbx6 is restricted to pre-somitic mesoderm, Pax7+ dermomyotome cells populate somites 1-18; in Ripply1 morphants, Tbx6 protein is expanded into the posterior trunk, Pax7+ cells are restricted to somites <7-14 (D). The Pax7 and Tbx6 expression domains (green and cyan lines, respectively) do not overlap; the dorsal and ventral domains of the trunk develop faster than the central domain (arrowheads). (E-G) At 24h, tbx6 mRNA expression is only slightly expanded in Ripply1 morphants (E); pax3 (F) and pax7 (G) are highly upregulated. (H,I) Immunolabeling shows an increase in Pax7+ dermomyotome cells in Ripply1 morphants. Boxes separately show Mef2+ (red) and Pax7+ nuclei (green, number indicated). (J,K) In wild type, slow muscle fibers (F59, cyan) are found lateral to fast fibers; Ripply1 morphants completely lack fast fibers (red, on cross-sections in J,K), slow fibers lie adjacent to the axial structures. β-catenin labels cell membranes, Hoechst all nuclei. Axis levels of images in H-K are indicated in G. Scale bars: 100µm in B,D,G; 50µm in I,K. EXPRESSION / LABELING:
PHENOTYPE:
|