
- Title
-
Formin-mediated actin polymerization at endothelial junctions is required for vessel lumen formation and stabilization
- Authors
- Phng, L.K., Gebala, V., Bentley, K., Philippides, A., Wacker, A., Mathivet, T., Sauteur, L., Stanchi, F., Belting, H.G., Affolter, M., Gerhardt, H.
- Source
- Full text @ Dev. Cell
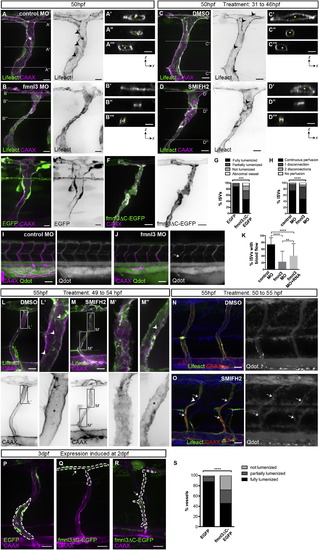
Formin Activity Is Required for Vessel Lumen Formation and Maintenance (A–D) Tg(fli1ep:Lifeact-EGFP);Tg(kdr-l:ras-Cherry)s916 embryos were injected with control or fmnl3 morpholino or treated with DMSO or 5 µM SMIFH2 from 31 to 46 hpf and examined at 50 hpf. The asterisk shows lumenized ISV, and arrowheads show junctional F-actin cables. Scale bars represent 10µm. (E–G) Mosaic expression of EGFP or fmnl3ΔC-EGFP in ISVs of Tg(kdr-l:ras-Cherry)s916 embryos at 52 hpf. ISVs with EGFP or fmnl3ΔC-EGFP expression were phenotyped for lumen defects (G). EGFP, n = 41 ISVs, n = 16 embryos; fmnl3ΔC-EGFP, n = 52 ISVs, n = 27 embryos. Scale bars represent 10 µm. (H–J) Tg(kdr-l:ras-Cherry)s916 embryos were injected with quantum dots (Qdot) at 54–57 hpf. The arrow shows discontinuous perfusion. Control MO, n = 134 ISVs, n = 28 embryos; fmnl3 MO, n = 186 ISVs, n = 36 embryos. Scale bars represent 50 µm. (K) Quantification of blood flow through ISVs. Control MO, n = 79 embryos; Fmnl3 MO, n = 87 embryos; Fmnl3 MO + 100pg fmnl3 mRNA, n = 64 embryos. Data represent mean ± SD. (L–O) Uninjected or Qdot-injected Tg(fli1ep:Lifeact-EGFP);Tg(kdr-l:ras-Cherry)s916 embryos were treated with DMSO or 10 µM SMIFH2 at 49–50 hpf and imaged 4–5 hr later. (L and M) Arrowheads show junctional F-actin cables. The arrow shows apical membrane, and the asterisk shows lumen. (O) Arrows show fragments of Qdot-filled vessels, and the arrowhead shows vessel disconnection. Scale bars represent 20 µm. (P–S) Mosaic endothelial EGFP or fmnl3ΔC-EGFP expression (serrated lines) was induced in Tg(kdr-l:ras-Cherry)s916 embryos at 2 dpf and examined at 71–77 hpf for lumen defects. Arrows show unlumenized vessel. EGFP, n = 42 ISVs, n = 16 embryos; fmnl3ΔC-EGFP, n = 57 ISVs, n = 33 embryos. Scale bars represent 20 µm. See also Figure S1. |
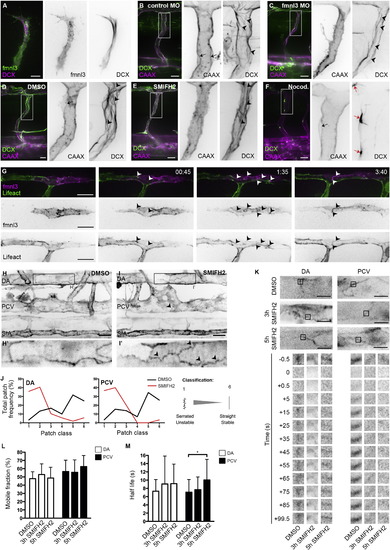
Formin Activity Promotes F-Actin Polymerization at EC Junctions (A) Coexpression of fmnl3-EGFP and DCX-mCherry in ISV at 32 hpf. Scale bar represents 10 µm. (B and C) ISVs of Tg(fli1ep:DCX-EGFP);Tg(kdr-l:ras-Cherry)s916 embryos injected with control or fmnl3 morpholino at 49 hpf. (D–F) Tg(fli1ep:DCX-EGFP);Tg(kdr-l:ras-Cherry)s916 embryos were treated with DMSO, 10 µM SMIFH2, or 0.5 µg/ml nocodazole at 48 hpf for 2 hr and imaged at 51–52 hpf. Arrowheads show microtubule filaments. Black arrows show apical membrane, and red arrows show microtubule organizing center. Scale bars represent 20 µm. (G) Mosaic endothelial fmnl3-mCherry expression in Tg(fli1ep:Lifeact-EGFP) embryo from 33 hpf. Arrowheads show localization of fmnl3 with F-actin at cell junctions. Scale bar represents 20 µm. (H–J) 3 to 4 dpf Tg(fli1ep:Lifeact-EGFP) embryos were treated with DMSO or 10 µM SMIFH2 for 4–5 hr. Arrowheads show serrated F-actin cables. DA, dorsal aorta. PCV, posterior cardinal vein. SIA, subintestinal artery. Scale bars represent 20µm. (J) Image analysis of F-actin cable profile at junctions of the DA or PCV. (K–M) Fluorescence recovery of EGFP-Actin at cell junctions after photobleaching. Three dpf Tg(fli1ep:EGFP-Actin) embryos were treated with DMSO for 5 hr or 10 µM SMIFH for 3 or 5 hr prior to photobleaching. Scale bar represents 10 µm. Plots of EGFP-Actin mobile fraction (L) and half-life (M) are shown from different treatments. Data represent mean ± SD. See also Figure S2. |
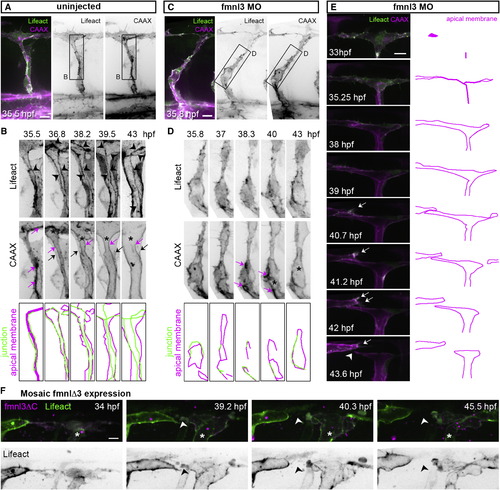
Junctional F-Actin Cables Assemble and Rearrange during Lumen Formation (A–D) Stills from time-lapse movies illustrating ISV lumenization in uninjected and in fmnl3 morpholino-injected Tg(fli1ep:Lifeact-EGFP);Tg(kdr-l:ras-Cherry)s916 embryos. The magenta arrow shows apical membrane. The black arrow show basal membrane, and the arrowhead shows junctional F-actin cable. The asterisk shows lumen in (B) and vacuole in (D). Scale bars represent 10 µm. (E and F) Stills from a time-lapse movie of the DLAV from a Tg(fli1ep:Lifeact-EGFP);Tg(kdr-l:ras-Cherry)s916 embryo injected with fmnl3 morpholino (E) or Tg(fli1ep:Lifeact-EGFP) embryo with mosaic fmnl3ΔC expression (*) (F). The arrow shows activated EC, and the arrowhead shows vessel disconnection. Scale bar represents 10 µm. See also Figure S3 and Movies S1, S2, and S3. |
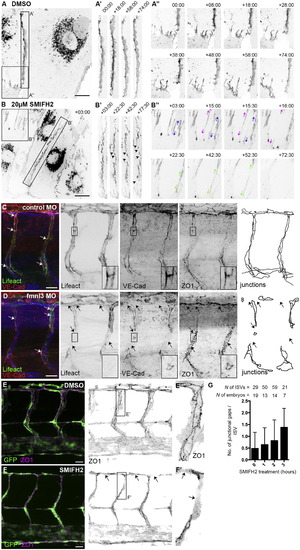
Formin Activity Is Essential for Junction Stability (A and B) Still images of VEC-EGFP-expressing HDMEC treated with 0.02% DMSO or 20 µM SMIFH2. Imaging began 5 min after addition of SMIFH2. A′ and B′ show linear junctions. A′′ and B′′ show FAJs. The arrowheads show gaps within linear junctions, and arrows show the direction of FAJ displacement. Scale bars represents 20 µm. (C–F) VEC and ZO1 immunostainings in ISVs and DLAV of control and fmnl3 morphants at 53 hpf (C and D) and in 2 dpf Tg(fli1a:EGFP)y1 embryos after 2 hr treatment with DMSO or 10µM SMIFH2 (E and F). Boxed regions in C and D show only endothelial staining. The arrows show junctional gaps. Scale bars represent 20 µm. (G) Quantification of junctional gaps within ISVs at 0, 1, 2 or 3 hr after 10µM SMIFH2 treatment. Data represent mean ± SD. See also Figure S4 and Movie S4. |
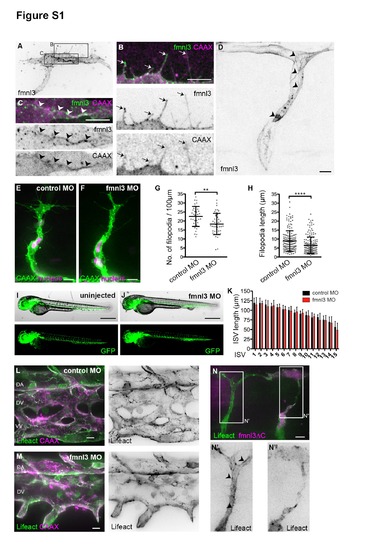
Fmnl3 regulates endothelial filopodia formation but not ISV formation. Related to Figure 1. (A – C) Mosaic endothelial fmnl3-EGFP expression in the ISV and DLAV in 31hpf Tg(kdr-l:ras-Cherry)s916 embryos. During the development of ISV and DLAV, fmnl3 localizes in vesicular structures in the cytoplasm and filopodia of ECs. (D) Fmnl3 localizes at cell junctions in lumenized ISV of a 48hpf embryo. (A – D) Arrows, filopodia. Arrowheads, cell junction. Scale bars, 10µm. (E - H) ISVs of 31 hpf Tg(kdr-l:ras-Cherry)s916;Tg(fli:nEGFP)y7 embryos injected with control or fmnl3 morpholino. Filopodia number per 100µm vessel length (G) and filopodia length (H) were quantified in 28 to 31 hpf Tg(kdr-l:ras-Cherry)s916 embryos. Filopodia number: Control MO, N = 38 ISVs, N = 22 embryos; fmnl3 MO, N = 45 ISVs, N = 30 embryos. Filopodia length: Control MO, N = 168 filopodia, N = 11 embryos; fmnl3 MO, N = 181 filopodia, N = 11 embryos. Bars represent mean ± SD. Scale bars, 10µm. (I – K) ISV length of fmnl3 morphants is comparable to that of control morphants. The length of the most posterior 15 ISVs in Tg(fli:GFP)y1 was measured at 50 hpf. Control MO, N = 10; fmnl3 MO, N = 12 embryos. Data represent mean ± SD. Scale bar, 500µm. (L – M) Vein plexi of 48hpf Tg(fli1ep:Lifeact-EGFP);Tg(kdrl: ras-Cherry)s916 embryos. Control morphants developed dorsal aorta (DA), dorsal vein (DV) and ventral vein (VV) at the vein plexus while fmnl3 morphants fail to form the VV. Scale bars, 10µm. (N) ISV and DLAV of Tg(fli1ep:Lifeact-EGFP) embryo at 32hpf with fmnlΔC-mCherry expression. Arrowhead, cortical F-actin cables. Scale bar, 10µm. |
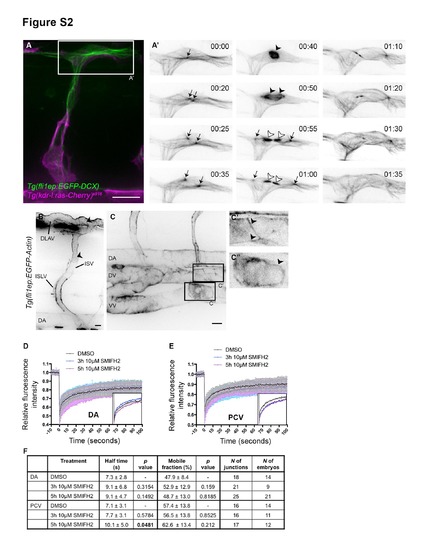
Transgenic zebrafish reporters for endothelial microtubule and actin cytoskeletons. Related to Figure 2. (A) Tg(fli1ep:EGFP-DCX) embryo at 32hpf. EGFP-DCX allows visualization of diverse microtubule structures during cell division. A single MTOC (microtubuleorganization centre; arrow; 00:00) doubles (00:20) and relocates to opposite poles of the dividing cell (00:25 and 00:35). A microtubule-based mitotic spindle forms (arrowhead; 00:40) between the centrosomes and allocates the chromosomes to the daughter cells. The cells divide (cytokinesis) and the central spindle (white arrowhead) and the MTOCs (arrows) are visible in each daughter cell. 00:00, hours:minutes. Scale bar, 20µm. (B and C) Tg(fli1ep:EGFP-Actin) embryos at 3dpf. EGFP-Actin highlights F-actin cables at cell junctions (arrowheads). ISV, intersegmental vessel; DLAV, dorsal longitudinal anastomotic vessel; ISLV, intersegmental lymphatic vessel; DA, dorsal aorta; DV, dorsal vein; VV, ventral vein. Scale bars, 10µm. (D and E) Fluorescence recovery curves of EGFP-Actin at junctions after DMSO or SMIFH2 treatment. (F) Mobile fraction and half-life of EGFP-Actin at DA or PCV junctions after DMSO or 10µM SMIFH2 treatment. Data represent mean ± SD. |
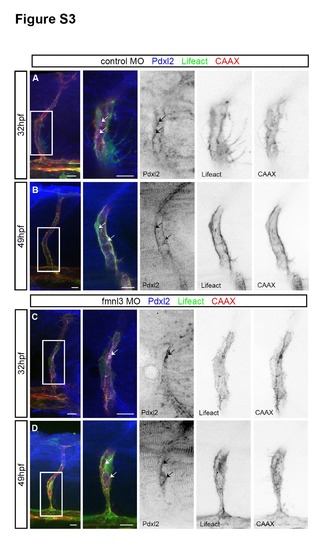
Apical domains are formed in fmnl3 morphants. Related to Figure 3. (A – D) Podocalyxin-like 2 (pdxl2) staining in 32 and 49 hpf Tg(fli1ep:Lifeact- EGFP);Tg(kdr-l:ras-Cherry)s916 embryos injected with control or fmnl3 morpholinos. Arrows, apical domains. Scale bars, 10µm. |
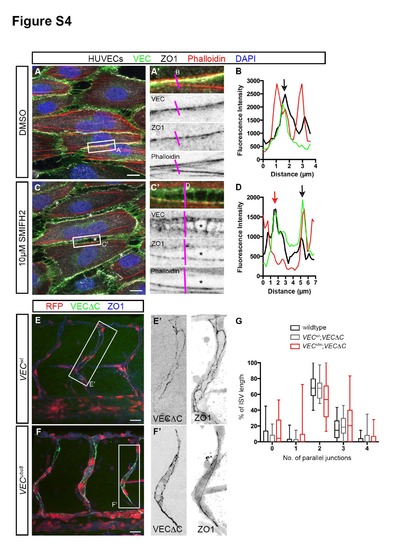
Junctional F-actin strengthens junction stability. Related to Figure 4. (A - D) HUVECs treated with either DMSO or 10µM SMIFH2 under high shear stress. In DMSO-treated cells, junctions at the long axis of cells exhibit linear morphology (A′) that consists of VEC, ZO1 and F-actin (black arrow, B). In SMIFH2-treated cells, intercellular gaps (*, C) appear between cells. Such junctions are characterized by a wider distribution of VEC, two ZO-1 lines and a loss of F-actin in some junctions (red arrow, D). Scale bar, 10µm. (E - G) ISV junction organization in 53hpf VECwt; Tg(fli1ep:GAL4FF)ubs3;Tg(UAS:mRFP);Tg(UAS:VECΔC-EGFP)ubs12 and VECubs8; Tg(fli1ep:GAL4FF)ubs3;Tg(UAS:mRFP);Tg(UAS:VECΔC-EGFP)ubs12 embryos. Embryos were immunostained with ZO1 antibody. The number of parallel junctions along the length of ISVs expressing VECΔC-EGFP was quantified (G). Scale bar, 20µm. |
Reprinted from Developmental Cell, 32, Phng, L.K., Gebala, V., Bentley, K., Philippides, A., Wacker, A., Mathivet, T., Sauteur, L., Stanchi, F., Belting, H.G., Affolter, M., Gerhardt, H., Formin-mediated actin polymerization at endothelial junctions is required for vessel lumen formation and stabilization, 123-32, Copyright (2015) with permission from Elsevier. Full text @ Dev. Cell