
- Title
-
Mechanistic target of rapamycin complex 1 signaling regulates cell proliferation, cell survival, and differentiation in regenerating zebrafish fins
- Authors
- Hirose, K., Shiomi, T., Hozumi, S., Kikuchi, Y.
- Source
- Full text @ BMC Dev. Biol.
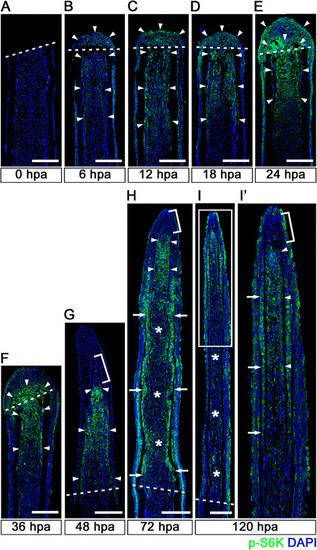
Spatiotemporal activation of S6K during zebrafish fin regeneration. (A-I′) Longitudinal sections of wild-type fin regenerates that were immunohistochemically stained with an antibody against p-S6K (green) at 0 (A), 6 (B), 12 (C), 18 (D), 24 (E), 36 (F), 48 (G), 72 (H), and 120 (I,I′) hpa (0 hpa, n = 3; 6 hpa, n = 4; 12 hpa, n = 3; 18 hpa, n = 4; 24 hpa, n = 5; 36 hpa, n = 4; 48 hpa, n = 3; 72 hpa, n = 4; 120 hpa, n = 3). The boxed area in I is enlarged in I′. DAPI fluorescent signal (blue) indicates the presence of nuclei. Dashed white lines indicate the amputation plane. The p-S6K fluorescent signals were barely detectable in the amputated fin at 0 hpa (A). At 6 hpa, p-S6K-positive cells were found in both intra-ray and epidermal cells (arrowheads in B), and the number of p-S6k-positive cells increased by 24 hpa (arrowheads in C, D, and E). Although p-S6K-positive cells were found in both the blastema and intra-ray region adjacent to and proximal to the amputation plane at 36 hpa (arrowheads in F), p-S6K-positive cells were mainly detected in the blastema at 48 hpa (arrowheads in G). At 72 and 120 hpa, p-S6K-positive cells were observed in the bilateral strip regions (arrows in H and I′), in the putative proximal medial blastema (arrowheads in H and I′), and in the wound epidermis, but not in the putative differentiated blastema cells (asterisks in H and I). Brackets indicate the p-S6K-negative cells in the tip of the putative proximal medial blastema domain and putative distal blastema (G,H,I′). It should be noted that both p-S6K and DAPI fluorescent signals did not overlap, as p-S6K and genomic DNA (DAPI specifically stains double-strand DNA) are localized in the cytosol and nucleus, respectively. Scale bars: 100 µm. |
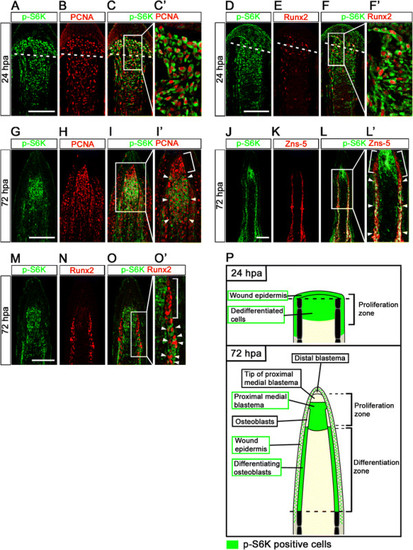
Distributions of S6K-positive cells and proliferative cells at 24 and 72 hpa. (A-F′) Longitudinal sections of wild-type fin regenerates that were co-immunohistochemically stained with antibodies against p-S6K (green) and PCNA (red) (A-C′, n = 3) or p-S6K (green) and Runx2 (red) (D-F′, n = 3) at 24 hpa. p-S6K positive cells were PCNA- or Runx2-positive at 24 hpa (C′,F′). The boxed areas in C and F are enlarged in C′ and F′, respectively. Dashed white lines indicate the amputation planes. (G-O′) Longitudinal sections of wild-type fin regenerates that were co-immunostained with antibodies against p-S6K (green) and PCNA (red) (G-I′, n = 5), p-S6K (green) and Zns-5 (red) (J-L′, n = 3), or p-S6K (green) and Runx2 (red) (M-O′, n = 4) at 72 hpa. PCNA-positive cells were p-S6K-positive in the putative proximal medial blastema domain (arrowheads in I′), but not in the tip of the putative proximal medial blastema domain (a bracket in I′). Zns-5- or Runx2-positive cells in the proximal lateral blastema were also p-S6K-positive (arrowheads in L′ and O′), but cells in the distal region of the lateral blastema were not (brackets in L′ and O′). It should be noted that both p-S6K and PCNA or Runx2 fluorescent signals did not overlap, because p-S6K and PCNA or Runx2 are localized in the cytosol and nucleus, respectively. Scale bars: 100 µm. (P) Cartoon summarizing the anatomical structures of fin regenerates in longitudinal cross-sections and localization of p-S6K-positive cells in the fin regenerates at 24 and 72 hpa. Dashed lines indicate the amputation planes. |
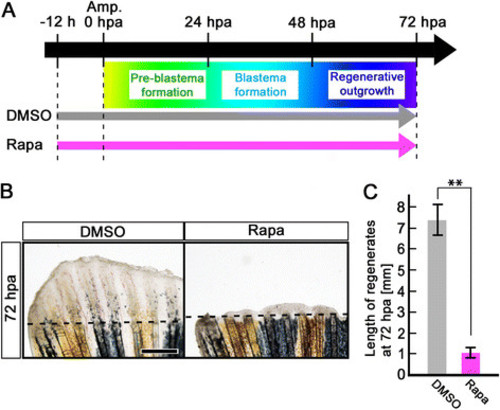
Rapamycin treatment inhibits fin regeneration until 72 hpa. (A) Scheme of rapamycin treatment from – 12 h to 72 hpa. (B, C) Rapamycin treatment significantly inhibited fin regeneration from – 12 h to 72 hpa (pre-blastema formation, blastema formation, and regenerative outgrowth stages), when compared to DMSO treatment. Dashed lines indicate the amputation planes. ** p < 0.01 by Student’s t-test. Error bars represent the standard error of 4 independent experiments. Scale bars: 500 µm in B. |
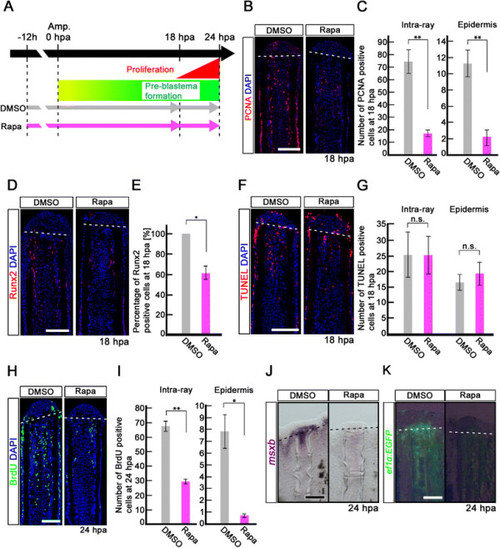
Rapamycin treatment inhibits proliferation of intra-ray and epidermal cells, but not apoptosis before blastema formation. (A) Scheme of rapamycin treatment before blastema formation. (B, C) PCNA-stained fin sections and quantification of PCNA-positive cells in the intra-ray and epidermis at 18 hpa. The number of PCNA-positive cells was significantly reduced by rapamycin treatment in both the intra-ray and epidermis at 18 hpa. **p < 0.01 by Student’s t-test. Error bars represent the standard error of 5 independent experiments. Scale bars: 100 µm. (D,E) Runx2-stained fin sections and quantification of Runx2-positive cells in the intra-ray. Rapamycin treatment significantly reduced the percentage of Runx2-positive cells at 18 hpa. *p < 0.05 by Student’s t-test. Error bars represent the standard error of 3 independent experiments. Scale bars: 100 µm. (F, G) TUNEL-stained fin sections and quantification of TUNEL-positive intra-ray and epidermal cells. Cell death was not increased in both the intra-ray and epidermis at 18 hpa. Error bars represent the standard error of 6 independent experiments. Scale bars: 100 µm. (H, I) BrdU-stained fin sections and quantification of BrdU-positive cells in the intra-ray and epidermis. Rapamycin treatment significantly reduced the number of BrdU-positive cells in the intra-ray and epidermis at 24 hpa. *p < 0.05 , **p < 0.01 by Student’s t-test. Error bars represent the standard error of 3 independent experiments. Scale bars: 100 µm. DAPI fluorescent signal (blue) indicates the presence of nuclei (B, D, F, H). Dashed white lines indicate the amputation planes (B, D, F, H). (J) Expression of msxb was examined by in situ hybridization at 24 hpa (n = 3). The msxb expression was barely detectable in rapamycin-treated fin regenerates. Scale bars: 200 µm. (K) EGFP fluorescence of Tg(ef1-α;EGFP) fin regenerates at 24 hpa (n = 3). The EGFP fluorescence was lost in rapamycin-treated fin regenerates. Scale bars: 200 µm. Dashed lines indicate the amputation plane (J, K). |
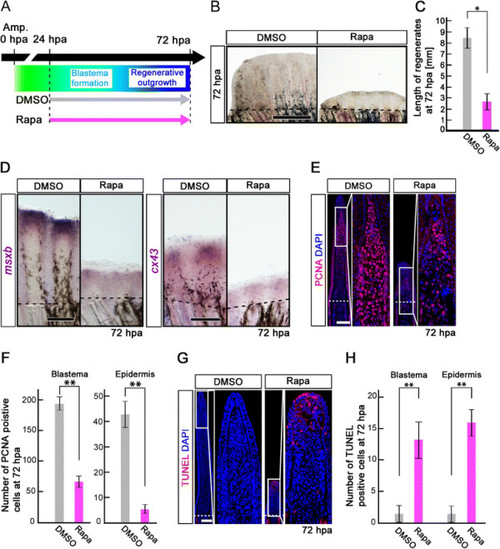
Rapamycin treatment inhibits both the proliferation and survival of intra-ray cells during the blastema formation and regenerative outgrowth stages. (A) Scheme of rapamycin treatment during blastema formation and regenerative outgrowth stages. (B, C) Rapamycin treatment significantly blocked the outgrowth of fin regenerates at 72 hpa. *p < 0.05 by Student’s t-test. Error bars represent the standard error of 4 independent experiments. Scale bars: 500 µm. Dashed lines indicate the amputation plane. (D) Expression of msxb and cx43 was examined by whole-mount in situ hybridization at 72 hpa (msxb, n = 5; cx43, n = 3). Rapamycin treatment induced the down-regulation of msxb and cx43 expression. Scale bars: 200 µm. Dashed lines indicate the amputation plane. (E, F) PCNA-stained fin sections and quantification of PCNA-positive cells in the intra-ray and epidermis at 72 hpa. The number of PCNA-positive cells was significantly reduced by rapamycin treatment in both the blastema and epidermis at 72 hpa. **p < 0.01 by Student’s t-test. Error bars represent the standard error of 4 independent experiments. Scale bars: 100 µm. (G, H) TUNEL-stained fin sections and quantification of TUNEL-positive cells in the intra-ray and epidermis. Cell death was significantly increased by rapamycin treatment in both the blastema and epidermis at 72 hpa. **p < 0.01 by Student’s t-test. Error bars represent the standard error of 4 independent experiments. Scale bars: 100 µm. DAPI fluorescent signal (blue) indicates the presence of nuclei (E, G). |
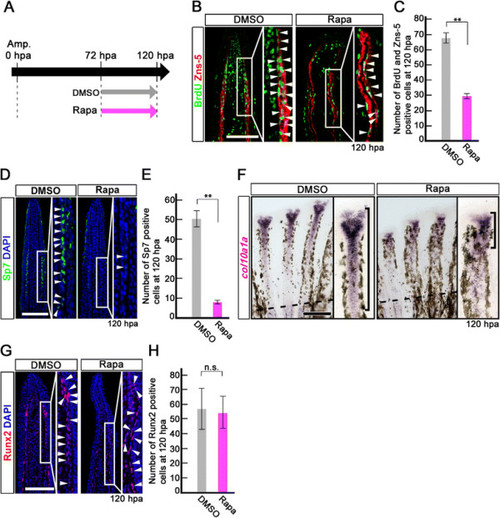
Rapamycin treatment inhibits proliferation and differentiation of osteoblasts after 72 hpa. (A) Scheme of rapamycin treatment between 72 and 120 hpa. (B, C) BrdU and Zns-5 double-stained fin sections and quantification of BrdU and Zns-5 double-positive osteoblasts. The number of double-positive osteoblasts was significantly reduced by rapamycin treatment at 120 hpa. **p < 0.01 by Student’s t-test. Error bars represent the standard error of 4 independent experiments. (D, E) Sp7-stained fin sections and quantification of Sp7-positive osteoblasts. The number of Sp7-positive osteoblasts was significantly reduced by rapamycin treatment at 120 hpa. DAPI fluorescent signal (blue) indicates the presence of nuclei. **p < 0.01 by Student’s t-test. Error bars represent the standard error of 4 independent experiments. Scale bars: 100 µm. (F) Expression of col10a1a was examined by in situ hybridization at 120 hpa (n = 4). Rapamycin treatment decreased col10a1a expression (brackets in F) at 120 hpa. Dashed lines indicate the amputation planes. Scale bars: 200 µm. (G, H) Runx2-stained fin sections and quantification of Runx2-positive cells. The number of Runx2-positive cells was not affected by rapamycin treatment at 120 hpa. Error bars represent the standard error of 4 independent experiments. Scale bars: 100 µm. |
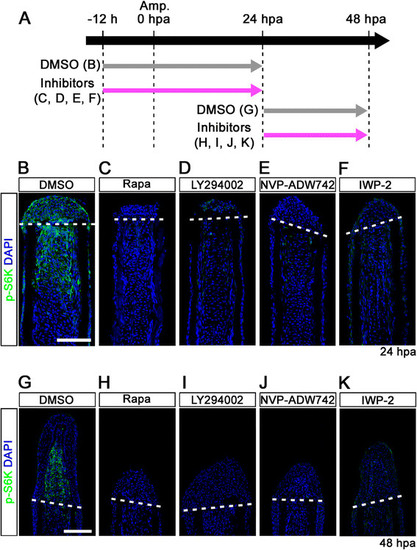
IGF-1R/PI3K and Wnt pathways regulate the activation of mTORC1 during fin regeneration. (A) Scheme of inhibitor treatments of rapamycin, LY294002 (a PI3K inhibitor), NVP-ADW742 (an IGF-1R inhibitor), or IWP-2 (a Wnt/β-catenin inhibitor) during fin regeneration. (B-K) Longitudinal sections of DMSO or inhibitors treated wild-type fin regenerates that were immunohistochemically stained with an antibody against p-S6K (green) at 24 (DMSO, n = 6; Rapa, n = 4; LY294002, n = 4; NVP-ADW742, n = 4; IWP-2, n = 5) and 48 hpa (DMSO, n = 6; Rapa, n = 4; LY294002, n = 4; NVP-ADW742, n = 4; IWP-2, n = 4). DAPI fluorescent signal (blue) indicates the presence of nuclei. The activation of S6K was blocked by LY294002, NVP-ADW742, or IWP-2 treatment. Dashed white lines indicate the amputation planes. Scale bars: 100 µm. |
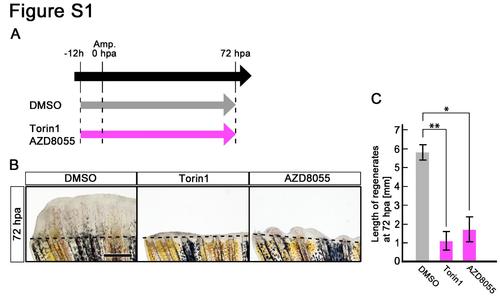
Treatment of Torin1 or AZD8055 inhibits fin regeneration until 72 hpa. (A) Scheme of Torin1 or AZD8055 treatment from – 12 h to 72 hpa. (B,C) Treatment of both inhibitors significantly inhibited fin regeneration from – 12 h to 72 hpa (pre-blastema formation, blastema formation, and regenerative outgrowth stages), when compared to DMSO treatment. Dashed lines indicate the amputation planes. *p < 0.05 , **p < 0.01 by Student’s t-test. Error bars represent the standard error of 4 independent experiments. Scale bars: 500 µm in B. |
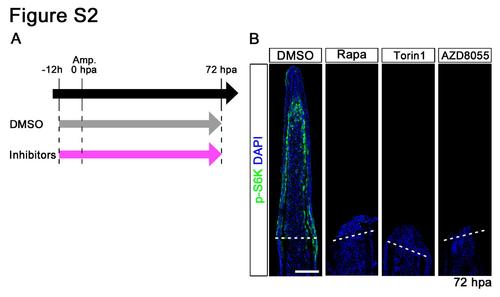
Distributions of p-S6K in rapamycin, Torin1, or AZD8055-treated fin regenerates at 72 hpa. (A) Scheme of rapamycin, Torin1, or AZD8055 treatment from – 12 h to 72 hpa. (B) Longitudinal sections of wild-type fin regenerates that were immunohistochemically stained with an antibody against p-S6K (green) at 72 hpa (DMSO, n = 5; Rapa, n = 3; Torin1, n = 3; AZD8055, n = 3). DAPI fluorescent signal (blue) indicates the presence of nuclei. At 72 hpa, the p-S6K fluorescent signal was lost in rapamycin, Torin1, or AZD8055- treated fin regenerates. Dashed white lines indicate the amputation plane. Scale bars: 100 µm. |
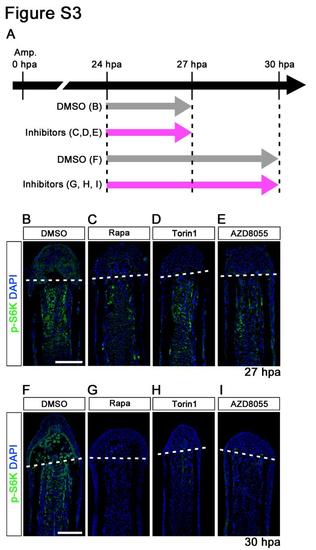
p-S6K signals were markedly reduced by 3 or 6 h treatment with inhibitors (rapamycin, Torin1, and AZD8055). (A) Scheme of rapamycin, Torin1, or AZD8055 treatment from 24 h to 27 or 30 hpa. (B-I) Longitudinal sections of wild-type fin regenerates that were immunohistochemically stained with an antibody against p-S6K (green) at 27 hpa (DMSO, n = 3; Rapa, n = 3; Torin1, n = 3; AZD8055, n = 3) or 30 hpa (DMSO, n = 3; Rapa, n = 3; Torin1, n = 3; AZD8055, n = 3). DAPI fluorescent signal (blue) indicates the presence of nuclei. The p-S6K signals were markedly reduced by 3 or 6 h treatment with inhibitors (rapamycin, Torin1, and AZD8055). Dashed white lines indicate the amputation plane. Scale bars: 100 µm. |
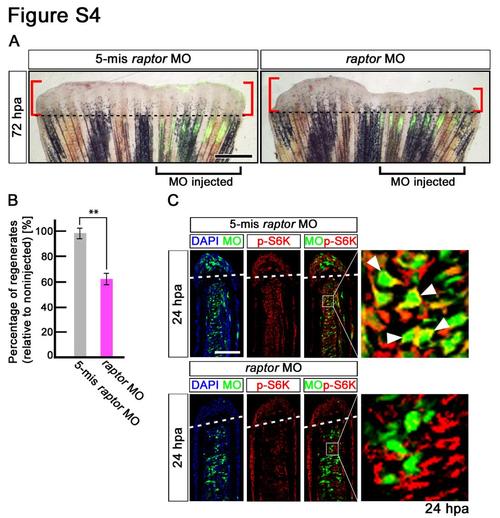
Fin regeneration and activation of mTORC1 signaling are inhibited by raptor knock-down. (A,B) Wild-type fin electroporated in the ventral half with fluorescein-labeled MOs at 72 hpa. Fin regeneration was significantly inhibited by raptor knock-down. Dashed lines indicate the amputation planes. Scale bars: 500 µm. **p < 0.01 by Student’s t-test. Error bars represent the standard error of 5 independent experiments. (C) Longitudinal sections of wild-type fin regenerates that were immunostained with antibodies against p-S6K (red) at 24 hpa (5-mismached raptor MO, n = 5; raptor MO, n = 5). Green fluorescence indicates the presence of MO in the electroporated cells. Merged views showed that cells incorporated 5-mismached raptorMO, but not raptor MO, are p-S6K-positive (arrowheads). It should be noted that fluorescent signals of 5- mismached raptorMO and p-S6K overlap only in the cytosol, because p-S6K are localized in the cytosol, not in the nucleus. Dashed white lines indicate the amputation planes. Scale bars: 100 µm. |
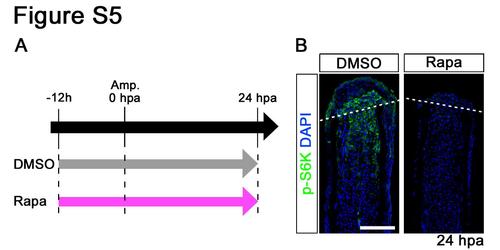
Distributions of p-S6K in rapamycin-treated fin regenerates at 24 hpa. (A) Scheme of rapamycin treatment from – 12 h to 24 hpa. (B) Longitudinal sections of wild-type fin regenerates that were immunohistochemically stained with an antibody against p-S6K (green) at 24 hpa (DMSO, n = 4; Rapa, n = 4). DAPI fluorescent signal (blue) indicates the presence of nuclei. At 24 hpa, the p-S6K fluorescent signal was lost in rapamycin-treated fin regenerates. Dashed white lines indicate the amputation plane. Scale bars: 100 µm. |
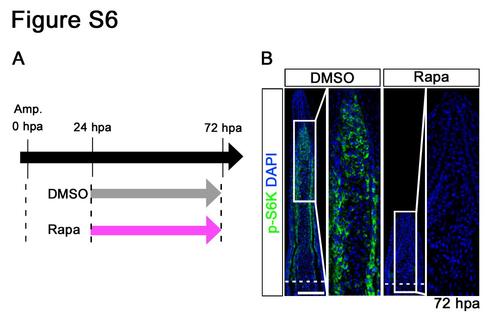
Distributions of p-S6K in fin regenerates treated with rapamycin from 24 to 72 hpa. (A) Scheme of rapamycin treatment from 24 to 72 hpa. (B) Longitudinal sections of wild-type fin regenerates that were immunohistochemically stained with an antibody against p-S6K (green) at 72 hpa (DMSO, n = 5; Rapa, n = 5). DAPI fluorescent signal (blue) indicates the presence of nuclei. At 72 hpa, the p-S6K fluorescent signal was lost in rapamycin-treated fin regenerates. Dashed white lines indicate the amputation plane. Scale bars: 100 µm. |
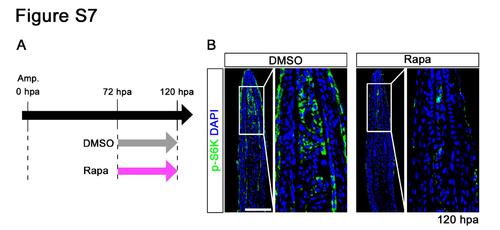
Distributions of p-S6K in fin regenerates treated with rapamycin from 72 to 120 hpa. (A) Scheme of rapamycin treatment from 72 to 120 hpa. (B) Longitudinal sections of wild-type fin regenerates that were immunohistochemically stained with an antibody against p-S6K (green) at 120 hpa (DMSO, n = 3; Rapa, n = 3). DAPI fluorescent signal (blue) indicates the presence of nuclei. At 120 hpa, the fluorescent signal of p-S6K was markedly reduced by rapamycin treatment. Scale bars: 100 µm. |
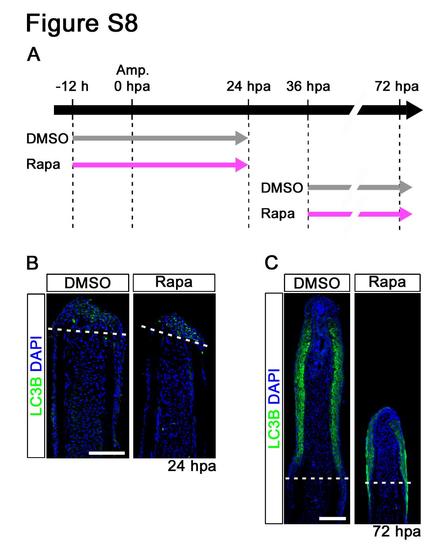
Distributions of LC3B in rapamycin treated fin regenerates. (A) Scheme of rapamycin treatment from -12 to 24 hpa or from 36 to 72 hpa. (B,C) Longitudinal sections of DMSO or rapamycin treated wild-type fin regenerates that were immunohistochemically stained with an antibody against LC3B (green) at 24 hpa (DMSO, n = 4; Rapa, n = 4) and 72 hpa (DMSO, n = 3; Rapa, n = 3). DAPI fluorescent signal (blue) indicates the presence of nuclei. LC3B is specifically localized in the wound epidermis at 24 and 72 hpa. Dashed white lines indicate the amputation planes. Scale bars: 100 µm. |
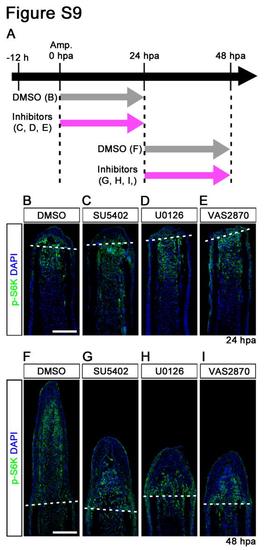
Fgf, MAPK/Erk, and ROS signaling pathways do not regulate the activation of mTORC1 during fin regeneration. (A) Scheme of inhibitor treatments of SU5402 (a Fgf receptor1 inhibitor), U0126 (a MAPK/Erk inhibitor), and VAS2870 (an NADPH oxidase inhibitor: ROS signaling) during fin regeneration. (B-I) Longitudinal sections of DMSO or inhibitors treated wild-type fin regenerates that were immunohistochemically stained with an antibody against p-S6K (green) at 24 or 48 hpa. DAPI fluorescent signal (blue) indicates the presence of nuclei. The p-S6K signals in SU5402-, U0126-, and VAS2870-treated fins were approximately comparable to those in DMSO-treated fins at both 24 hpa (DMSO, n = 6; SU5402, n = 5; U0126, n = 3; VAS2870, n = 3) and 48 hpa (DMSO, n = 6; SU5402, n = 4; U0126, n = 3; VAS2870, n = 3), even though these inhibitors, at 48 hpa, prevented fin regeneration. Dashed white lines indicate the amputation planes. Scale bars: 100 µm. |