
- Title
-
A vertebrate-conserved cis -regulatory module for targeted expression in the main hypothalamic regulatory region for the stress response
- Authors
- Gutierrez-Triana, J., Herget, U., Lichtner, P., Castillo-Ramírez, L.A., Ryu, S.
- Source
- Full text @ BMC Dev. Biol.
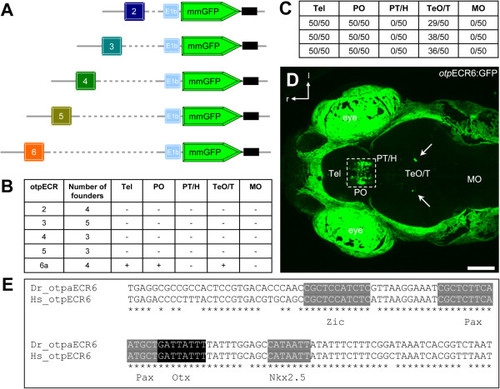
Enhancer activity displayed by stableotpECR-transgenic lines. A, A schematic depiction of constructs used to generate the transgenic lines. B, Enhancer activity displayed by transgenic lines analyzed at 3-5 dpf. The table shows the GFP levels and expression patterns observed in cardiac-RFP positive founders for the individual otpECRs. C, Numbers of larvae showing GFP+ cells within different brain regions (Data from 3 independent clutches are shown, n = 50 per clutch). In all animals, the caudal telecephalic-preoptic cluster is present, and in many animals, few ectopic cells appear in the tectal-tegmental region. D, Confocal z-stack maximum projection of a dorsal in vivo view of Tg(otpECR6-E1b:mmGFP) expression. GFP is expressed in a dense cluster within the preoptic area and extends into the caudal telencephalon. In many larvae, a few isolated ectopic cells can be detected in the midbrain. E, The evolutionarily conserved region otpECR6 contains predicted binding sites for transcription factors belonging to the families Otx, Pax, Nkx and Zic. The otpECR6 DNA sequences of zebrafish (Dr) and human (Hs) were aligned and analyzed using the multiF program (https://multitf.dcode.org webcite of the ECR browser). Abbreviations: Tel, telencephalon; PO, preoptic area; PT, posterior tuberculum; H, hypothalamus; TeO, optic tectum; T, tegmentum; MO, medulla oblongata; r, rostral; l, lateral. Scale bar: 100 µm. EXPRESSION / LABELING:
|
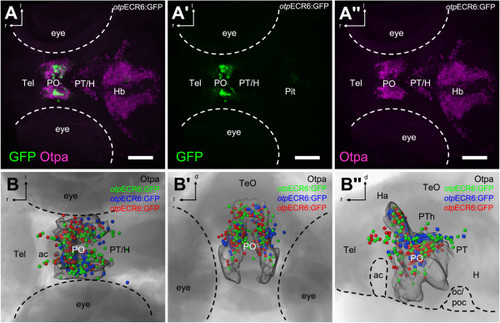
otpECR6 displays enhancer activity in the forebrain with expression in cells localizing within the caudal telencephalon and dorsal half of the preoptic Otpa domain.A, Confocal z-stack maximum projection of an immunohistochemically stained 5 dpf Tg(otpECR6-E1b:mmGFP) larva double-labeled for GFP (A′) and Otpa (A′′). B, Reconstructed localization and variability of GFP-expressing cells. Colors represent three representative maps derived from three different animals after registration using the outlines of the Otpa signal as references (transparent surface). Abbreviations: Tel, telencephalon; PO, preoptic area; PT, posterior tuberculum; H, hypothalamus; Hb, hindbrain; Pit, pituitary; ac, anterior commissure; TeO, optic tectum; Ha, habenula; PTh, prethalamus; oc, optic chiasm; poc, postoptic commissure; r, rostral; l, lateral; d, dorsal. Scale bars: 100 µm. EXPRESSION / LABELING:
|
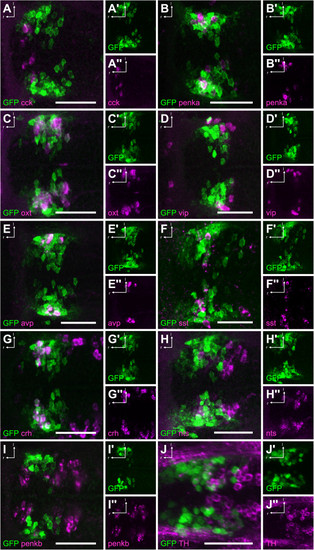
NPO cells involved in the HPA axis are labeled in theTg(otpECR6-E1b:mmGFP)transgenic line. A, There is no overlap of GFP with in situ stained cck+ cells. B, There is some overlap of GFP with penka+ cells. C, There is extensive overlap of GFP with oxt+ cells. D, There is no overlap of GFP with vip+ cells. E, There is a high degree of overlap of GFP with avp+ cells. F, There is some overlap of GFP with sst1.1+ cells. G, There is a high degree of overlap of GFP with crh + cells. H, There is some overlap of GFP with nts+ cells. I, There is no overlap of GFP with penkb + cells. J, There is no overlap of GFP with immunostained TH+ cells. Abbreviations: r, rostral; l, lateral. Scale bars: 50 µm. EXPRESSION / LABELING:
|
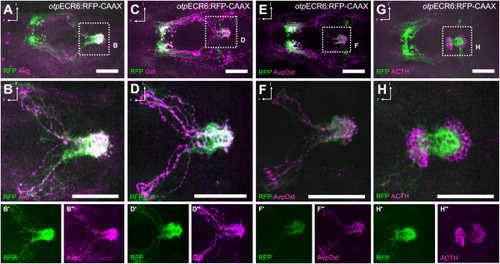
A group of cells labeled by the activity of theotpECR6 enhancer project to the pituitary. A-D, Costaining of RFP with Avp (A) or Oxt (C) as typical hypophysiotropic cell types shows a high degree of overlap of fibers reaching the pituitary (magnified views in B and D). E, Costaining of RFP with Avp and Oxt combined (magnified view in F). G, Costaining with ACTH as a pituitary marker confirms the dense RFP bundles as part of the pituitary (magnified view in H). Abbreviations: r, rostral; l, lateral. Scale bars: 100 µm. EXPRESSION / LABELING:
|
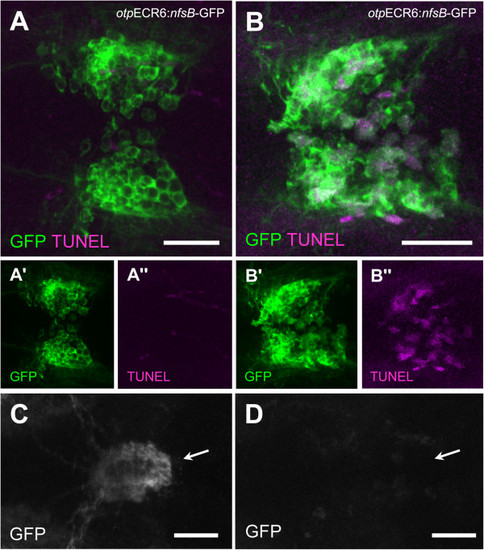
Nitroreductase-expressing cells inTg(otpECR6-E1b:nfsb-GFP)larvae display a reduction in the number of projections to the pituitary and an increase in apoptotic bodies when exposed to Mtz. A, TUNEL staining of the preoptic GFP expression domain in an untreated larva. B, TUNEL staining of the preoptic GFP expression domain in an Mtz-treated larva. C, Pituitary bundles of GFP-stained fibers in a control larva (arrow). D, The pituitary location in an Mtz-treated larva (arrow). Note that in the control larva, the GFP fibers reach the pituitary and no apoptosis is detected, but in the Mtz-treated larva, the pituitary innervation is disrupted and apoptosis is apparent in preoptic cell bodies. Scale bars: 50 µm. |