
- Title
-
Retinal Injury, Growth Factors, and Cytokines Converge on β-Catenin and pStat3 Signaling to Stimulate Retina Regeneration
- Authors
- Wan, J., Zhao, X.F., Vojtek, A., Goldman, D.
- Source
- Full text @ Cell Rep.
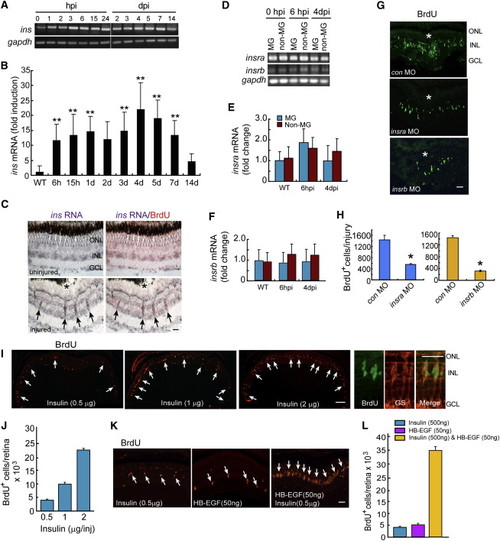
Insulin and HB-EGF Are Sufficient to Stimulate MG Proliferation in the Uninjured Retina (A and B) RT-PCR and qPCR analysis of injury-dependent ins gene expression. Error bars represent SD; p < 0.01; n = 5. (C) In situ hybridization (purple) and BrdU immunofluorescence (red) shows injury-dependent ins gene induction in proliferating MG-derived progenitors at 4 dpi. Arrows point to BrdU+ cells expressing ins RNA. Scale bar represents 50 µm. (D) RT-PCR analysis of insra and insrb gene expression in FACS purified MG and non-MG. (E and F) qPCR analysis of insra (E) and insrb (F) gene expression in MG and non-MG. Error bars represent SD; n = 4. (G and H) MO-mediated Insra and Insrb knockdown suppresses the generation of MG-derived progenitors at 4 dpi. Scale bar (G) is 50 µm. Asterisk (G) marks the injury site. Error bars (H) represent SD; p < 0.05; n = 3. (I and J) Insulin stimulates MG proliferation in the uninjured retina. Arrows (I) point to BrdU+ MG. Scale bar represents 150 µm. The three right-hand panels show BrdU+ progenitors express the MG marker glutamine synthetase (GS). Error bars (J) represent SD; n = 3. (K and L) HB-EGF and Insulin synergize with each other to stimulate MG proliferation in the uninjured retina. Arrows point to BrdU+ MG. Scale bar represents 50 µm. Error bars represent SD; n = 3. See also Figure S1. |
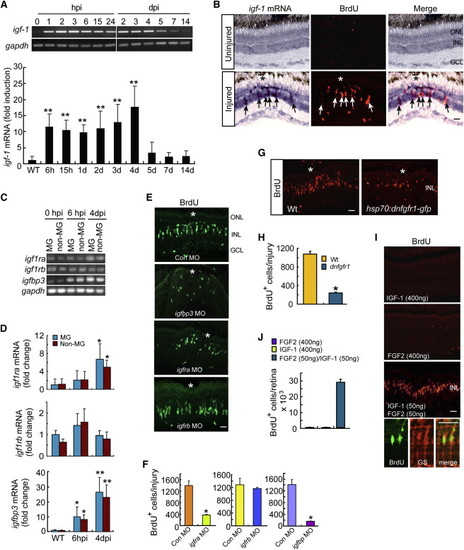
IGF-1 and FGF2 Synergize with Each Other to Stimulate MG Proliferation in the Uninjured Retina (A) RT-PCR and qPCR analysis of injury-dependent induction of igf-1 mRNA. Error bars represent SD; p < 0.001; n = 6. (B) In situ hybridization shows injury-dependent induction of igf-1 RNA in BrdU+ progenitors (arrows) at 4 dpi. Scale bar represents 50 µm. Asterisk marks the injury site. (C and D) RT-PCR (C) and qPCR (D) analysis of igf1ra, igf1rb and igfbp3 gene expression in FACS purified MG and non-MG at different times post retinal injury. Error bars (D) represent SD; p < 0.05, p < 0.01; n = 4. (E) BrdU immunofluorescence shows effect of morpholino (MO)-mediated knockdown of Igfbp3, Igfra, or Igfbp on progenitor formation in the injured retina. Scale bar represents 50 µm. Asterisk marks the injury site. (F) Quantification of BrdU+ cells in (E). Error bars represent SD; p < 0.05; n = 3. (G) BrdU immunofluorescence shows that conditional overexpression of dnFgfr1 in hsp70:dnfgfr1-egfp fish suppresses the generation of BrdU+ progenitors at 4 dpi. Asterisk marks the injury site. Scale bar represents 50 µm. (H) Quantification of BrdU+ cells in (G). Error bars represent SD; p < 0.05 n = 3. (I) BrdU immunofluorescence shows IGF-1 and FGF2 synergize to stimulate MG proliferation in the uninjured retina. Scale bar represents 50 µm. Bottom three panels show that BrdU+ cells are also GS+ MG. (J) Quantification of BrdU+ cells in I. Error bars represent SD; n = 3. See also Figure S2. |
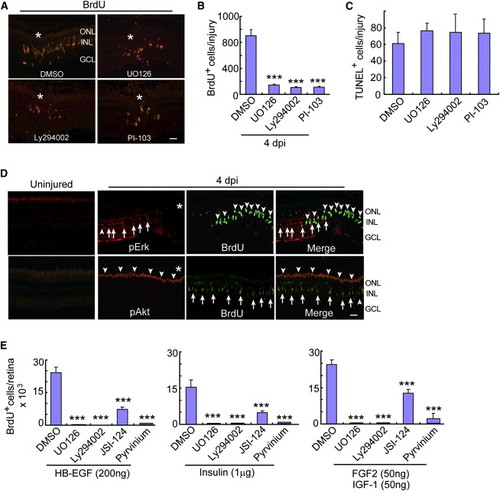
Mapk/Erk, PI3K/Akt, β-Catenin, and Jak/Stat Signaling Regulate Injury and Growth Factor-Stimulated MG Proliferation (A and B) Mapk/Erk inhibitor (UO126) or PI3K inhibitors (Ly294002 or PI-103) reduce the number of BrdU+ progenitors at 4 dpi. Asterisks identify the injury site. Scale bar represents 50 µm. Error bars represent SD; p < 0.001; n = 6. (C) TUNEL assay shows Mapk and PI3K inhibitors have no effect on cell death. (D) pErk and pAkt immunofluorescence in uninjured and injured (4 dpi) retinas. Asterisks identify the injury site. In the pErk panels, arrows point to pErk+ MG and arrowheads point to BrdU+ cells. In pAkt panels, arrowheads point to pAkt+ cells, while arrows point to BrdU+ cells. Scale bar represents 50 µm. (E) In the growth factor stimulated, but uninjured retina, BrdU+ progenitor formation is suppressed by inhibiting Mapk (UO126), PI3K (Ly294002), Jak/Stat (JSI-124) or β-catenin (pyrvinium) signaling. Error bars represent SD; p < 0.001; n = 5. See also Figures S2–S4. PHENOTYPE:
|
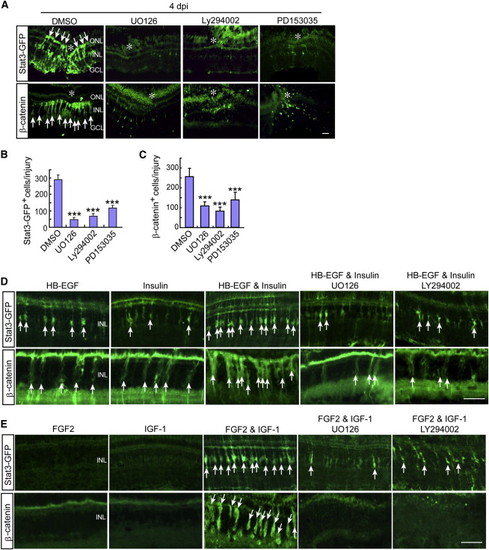
Injury and Growth Factor-Dependent Activation of β-Catenin and Stat3 Signaling in MG-Derived Progenitors Requires Mapk/Erk and PI3K/Akt Signaling (A) Stat3-GFP and β-catenin immunofluorescence shows that inhibition of Mapk (UO126), PI3K (Ly294002), or the Egf receptor (PD153035) suppresses injury-dependent Stat3-GFP and β-catenin accumulation in gfap:stat3-gfp transgenic fish. Asterisks mark the injury site and arrows point to Stat3-GFP+ and β-catenin+ progenitors. Scale bar represents 50 µm. (B and C) Quantification of data shown in (A). Error bars represent SD; p < 0.05; p < 0.001; n = 4. (D and E) Stat3-GFP and β-catenin immunofluorescence shows that intravitreally injected HB-EGF (50 ng) and Insulin (0.5 µg) (D) or FGF2 and IGF-1 (individually at 400 ng or together at 50 ng each) (E) act in a synergistic fashion to stimulate Stat3-GFP and β-catenin accumulation in the uninjured retina of gfap:stat3-gfp transgenic fish and their action is suppressed by inhibition of Mapk (UO126) or PI3K (Ly294002) signaling. Arrows point to Stat3-GFP+ and β-catenin+ progenitors. Scale bar represents 50 µm. |
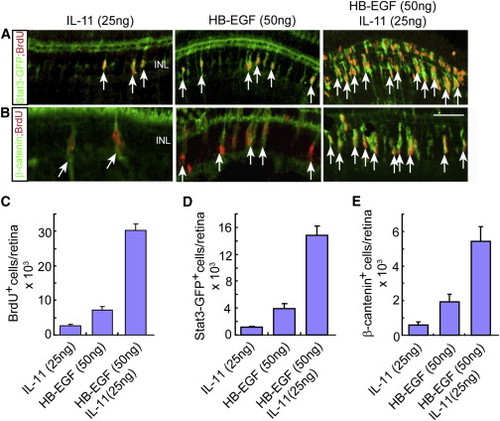
HB-EGF and IL-11 Synergize with Each Other to Stimulate MG Proliferation and Activation of the Stat3 and β-Catenin Signaling Components in the Uninjured Retina (A and B) HB-EGF and IL-11 synergize with each other to stimulate the generation of BrdU+ progenitors and the accumulation of Stat3 (A) and β-catenin (B) signaling components in the uninjured retina of gfap:stat3-gfp transgenic fish. Arrows point to double-labeled cells. Scale bar represents 50 µm. The green immunofluorescence signal in the photoreceptor layer is nonspecific, since it does not show up when using a secondary antibody coupled to a red Fluor (Figure S7). (C–E) Quantification of BrdU+ (C), Stat3-GFP+ (D), and β-catenin+ (E) progenitors in retinas intravitreally injected with HB-EGF, IL-11, or HB-EGF/IL-11. Error bars represent SD; n = 3. See also Figure S5. |
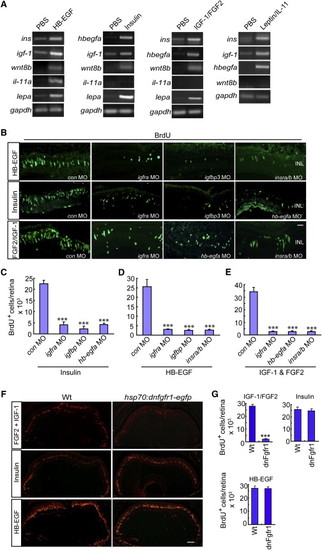
Crosstalk among HB-EGF, Insulin, IGF-1/FGF, and IL-11/Leptin Signaling Components Contributes to MG Proliferation in the Uninjured Retina (A) RT-PCR shows the effect of intravitreal injection of HB-EGF, Insulin, IGF-1/FGF2, or Leptin/IL-11 on each other’s expression and also the regeneration-associated factor, wnt8b. (B) BrdU immunofluorescence shows that MO-mediated knockdown of specific HB-EGF, Insulin, and IGF-1 signaling components suppress each other’s ability to stimulate MG proliferation in the uninjured retina. Scale bar represents 50 µm. (C–E) Quantification of data presented in (B). Error bars represent SD; p < 0.001; n = 4. (F) Conditional overexpression of dnFgfr1 in hsp70:dnfgfr1-egfp fish inhibits FGF2/IGF-1-dependent MG proliferation, but not Insulin or HB-EGF-dependent MG proliferation, in the uninjured retina. Scale bar represents 150 µm. (G) Quantification of data presented in (F). Error bars represent SD. p < 0.001; n = 3. See also Figure S6. |