
- Title
-
Nipbl and Mediator Cooperatively Regulate Gene Expression to Control Limb Development
- Authors
- Muto, A., Ikeda, S., Lopez-Burks, M.E., Kikuchi, Y., Calof, A.L., Lander, A.D., Schilling, T.F.
- Source
- Full text @ PLoS Genet.
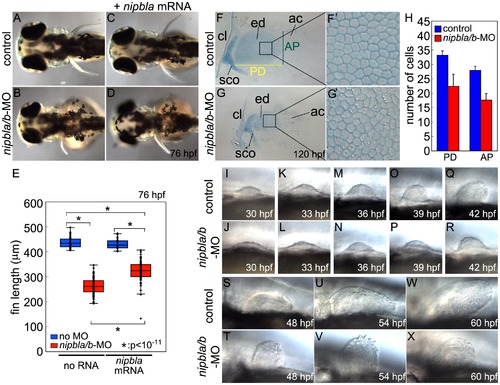
Nipbl knockdown disrupts pectoral fin development. (A–D) Reduced pectoral fins in live Nipbl-deficient embryos at 76 hpf. Dorsal views, anterior to the left. Uninjected control (A), Nipbl-deficient (nipbla/b-MO) (B), injected with 400 pg of nipbla mRNA alone (C) and co-injected with nipbla/b-MO+nipbla mRNA (D). (E) Whisker plots of fin length at 76 hpf; medians: 431.8 μm, n = 50 (control), 258.5 µm, n = 88 (nipbla/b-MOs), 423.0 μm, n = 22 (nipbla mRNA alone), and 319.5 μm, n = 70 (nipbla/b-MOs+nipbla mRNA). p-values are indicated in the graph. (F, F2, G, G2) Alcian blue staining of cartilages in pectoral fins in control (F, F2) and Nipbl-deficient embryos (G, G2) at 120 hpf. F2 and G2 are higher magnification pictures of boxed areas of endoskeletal discs in F and G, respectively. ac, actinotrichs; cl, cleithrum; ed, endoskeletal disc; sco, scapulocoracoid. (H) Numbers of endoskeletal cells in pectoral fins along proximodistal (PD) and anteroposterior (AP) axes (control; n = 13, Nipbl-deficient embryos; n = 16). PD (Ave ± S.D.): 33.2±1.5 (control) and 22.4±4.2 (Nipbl-deficient embryos), p<10-8. AP (Ave ± S.D.): 27.9±1.5 (control) and 17.7±2.2 (Nipbl-deficient embryos), p<10-13. (I-X) Morphology of developing pectoral fin buds in live embryos. Lateral views, anterior and dorsal to the left and top, respectively. |
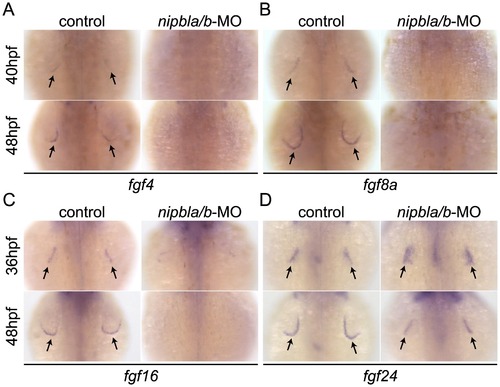
Reduced expression of fgfs in the AER of Nipbl-deficient embryos. Expression of fgf4 (A), fgf8a (B), fgf16 (C) and fgf24 (D) in the AER (arrows) at indicated stages in control and Nipbl-deficient embryos examined by ISH. Dorsal views, anterior to the top. |

Reduction of genes involved in the shh-related gene regulatory cassette in developing pectoral fin mesenchyme of Nipbl-deficient embryos. Expression of fin mesenchymal genes at indicated stages in control and Nipbl-deficient embryos examined by ISH. Dorsal views, anterior to the top. (A, B) Expression of shha and ptch2 in pectoral fin buds (arrows) was significantly reduced in Nipbl-deficient embryos, while midline, neural tube expression was unaffected. Expression in endoderm derived-tissues (asterisks) is also reduced. (C) Expression of hand2 was also significantly reduced in stage-matched pectoral fin buds. hand2 expression in the fin buds and posterior lateral plate mesoderm is marked by brackets and arrowheads, respectively. (D) gli3 expression was not significantly affected in a stage-matched comparison. |

Nipbls are required for spatial patterns of hoxd expression in pectoral fin buds. (A) Diagram of zebrafish hoxda cluster. (B, C) Expression of 3′-hoxd genes including hoxd3a and d4a (B) and 5′-hoxd genes including hoxd9a-d13a (C) was examined by ISH at 32 and 36 hpf to show both time-matched and stage-matched (nipbla/b-MO at 36 hpf and control at 32 hpf) comparisons. Dorsal views, anterior to the top. |
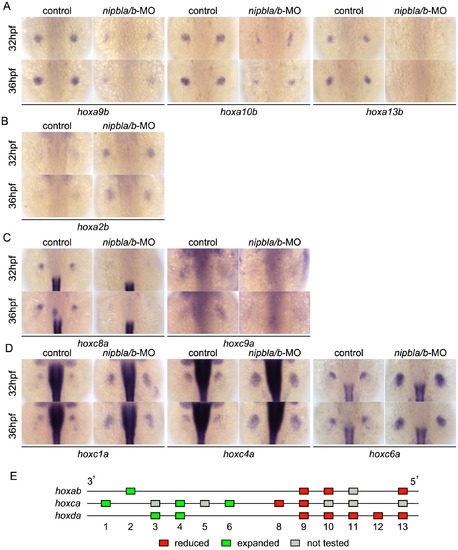
Nipbls regulate hox gene expression according to genomic location. (A–D) Expression of genes in hoxab (A,B) and hoxca (C,D) clusters was examined by ISH. (A) 5′-hoxa, (B) 3′-hoxa, (C) 5′-hoxc, and (D) 3′-hoxc genes. Dorsal views, anterior to the top. (E) Diagram summarizing effects of Nipbl reduction on hox genes. Genes located closer to 5′-ends show reduced expression (red boxes) whereas those closer to 3′-ends become expressed across entire fin buds (green boxes). |
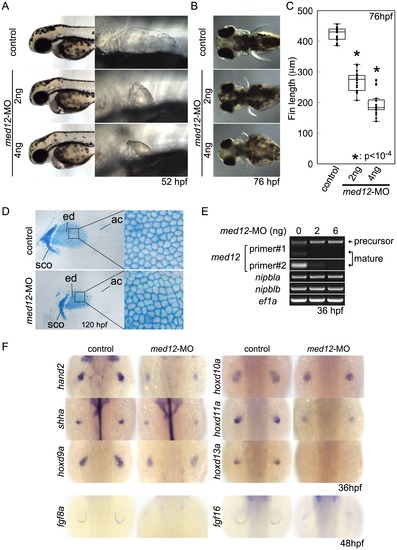
Med12 depletion disrupts pectoral fin morphology and gene expression similar to Nipbl depletion. (A, B) Morphology of live embryos at 52 hpf (A, lateral views) and 76 hpf (B, dorsal views). (A) Anterior halves of control and med12-MO-injected embryos (left column) and higher magnification pictures of their pectoral fin buds (right column). (B) Dorsal views of embryos at 76 hpf. (C) Whisker plots of fin length. Fin lengths (medians) are 430.0 μm, n = 18 (control), 275.6 μm, n = 20 (med12-MO, 2 ng), and 183.8 μm, n = 20 (med12-MO, 4 ng). *: p<10-4. (D) Alcian blue staining of pectoral fin cartilage of control (upper) and Med12-deficient (med12-MO, 4 ng; lower) embryos at 120 hpf. Dorsal view, anterior to the top. Right column, higher magnification pictures of boxed areas of endoskeletal discs. ac, actinotrichs; ed, endoskeletal disc; sco, scapulocoracoid. (E) Controls for med12-MO efficiency. RT-PCR, 36 hpf. Both pairs of med12 primers (Primer #1 and #2) show that splicing of med12 mRNA is significantly suppressed by med12-MO, with a slightly higher efficiency at 6 ng. Primer pair #1 detects both precursor and mature mRNA, whereas primer pair #2 only detects mature mRNA (see Materials and Methods). nipbla and nipblb expression was not affected by Med12 depletion. ef1a was used as a control. (F) Expression of genes involved in the 5′-hox/hand2/shha gene cassette and AER fgf genes in pectoral fin buds examined by ISH at 36 hpf. Dorsal views, anterior to the top. Similar to Nipbl-deficient embryos, shha, hand2 and 5′-hoxd genes in mesenchyme as well as fgf16 and fgf8a in the AER are reduced in Med12-deficient embryos (4 ng/embryo med12-MO). |
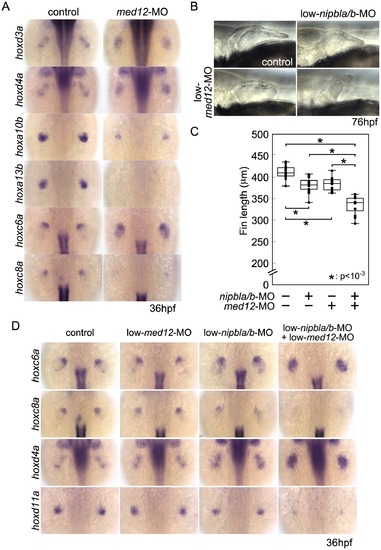
Functional interactions between Nipbl and Med12 in pectoral fin development. (A) hox gene expression in pectoral fin buds of Med12-deficient embryos examined by ISH at 36 hpf. Dorsal views with anterior to the top. (B) Lateral views of pectoral fins in living larvae at 76 hpf in controls or injected with 0.5 ng med12-MO alone (low-med12-MO). (C) Pectoral fin lengths in larvae injected with low-med12-MO alone or combined with low amounts of nipbl-MOs (0.05 ng nipbla-MO+0.75 ng of nipblb-MO; low-nipbla/b-MO). Medians: 410.1 μm, n = 16 (control), 382.2 μm, n = 24 (low-nipbla/b-MOs), 385.4 μm, n = 16 (low-med12-MO alone), and 341.4 μm, n = 16 (low-med12-MO+low-nipbla/b-MOs). Asterisks indicate statistical significance (p-values<0.001). (D) hox expression in larvae injected with low-med12-MO alone or combined with low nipbla/b-MO. Dorsal views, anterior to the top. EXPRESSION / LABELING:
PHENOTYPE:
|
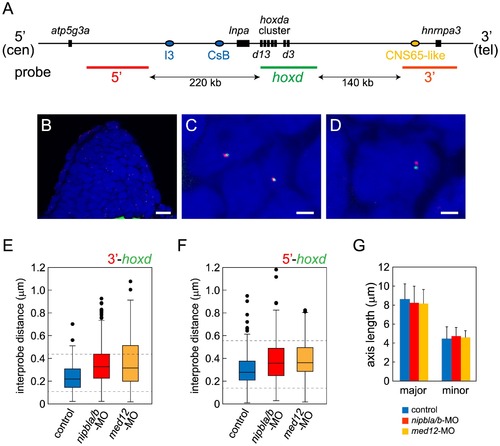
Nipbls and Med12 play roles in regulation of higher-order chromosome conformation at the Hoxd locus in pectoral fin buds. (A) Diagram of the genomic organization at the zebrafish hoxda locus. Genes in the hoxda cluster and flanking genes are shown as black boxes. Putative regulatory elements conserved between zebrafish and mouse and probes used for FISH are shown as colored ovals and lines, respectively. (B–D) Typical images of FISH. (B) Low magnification picture of a sagittal section of pectoral fin bud. Scale bar = 10 μm. (C,D) Higher magnification images of nuclei with colocalized (C) and separate signals (D). Hybridized probes are detected as green and red fluorescent dots in DAPI-stained nucleus. Scale bar = 2 μm. (E,F) Whisker plots of interprobe distances between hoxd and 3′ probes (E) or hoxd and 5′ probes (F) at 38 hpf. Medians, numbers of nuclei and embryos, and p-values calculated by the non-parametric Mann-Whitney U-test are shown in Table 2. Dotted lines indicate thresholds for separated (upper) and closed (lower) signals in Table 2. (G) Sizes of nuclei in pectoral fin buds (n = 30 each) were estimated at 38 hpf by measuring major and minor axes. Major axis (Ave ± S.D.): 8.58±1.63 μm (control), 8.22±1.76 μm (nipbla/b-MOs, p = 0.412), and 8.14±1.43 μm (med12-MO, p = 0.280). Minor axis (Ave ± S.D.): 4.41±1.28 μm (control), 4.70±0.92 μm (nipbla/b-MOs, p = 0.314), and 4.56±0.73 μm (med12-MO, p = 0.577). p-values were calculated by Student′s t-test. PHENOTYPE:
|