
- Title
-
Systematic transcriptome analysis of the zebrafish model of diamond-blackfan anemia induced by RPS24 deficiency
- Authors
- Song, B., Zhang, Q., Zhang, Z., Wan, Y., Jia, Q., Wang, X., Zhu, X., Leung, A.Y., Cheng, T., Fang, X., Yuan, W., Jia, H.
- Source
- Full text @ BMC Genomics

Hemoglobin staining of embryos injected with rps24 MO using o-dianisidine and effectiveness of rps24 MO. (A-F) O-staining of rps24 MO embryos showed a drastic reduction in the number of hemoglobin-stained blood cells when rps24 is knockdown (A and D are controls, B and E are rps24 knockdown) and partially rescued phenotype by co-injection of p53 MO (C and F). (G-H) The sequence of rps24 MO is a compliment of 1-24 bp of rps24 cDNA. Embryos co-injected with 25 ng rps24: egfp DNA and 5 ng control MO produced green fluorescent protein (G), and the expression of green fluorescent fusion protein was inhibited by co-injection with 2 ng rps24 Mo (H). A, B, C are ventral view; D, E, F, G and H are lateral view. PHENOTYPE:
|
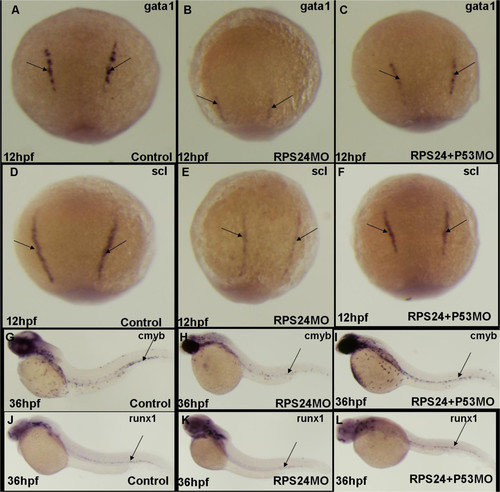
RPS24 is required for both primitive and definitive hematopoiesis zebrafish partly mediated by p53 pathway. (A-C) The expression of gata1 (black arrow) was significantly decreased in rps24 MO and can be partly rescued in rps24 and p53 double MO at 48 hpf. (D-F) The expression of scl was significantly decreased in rps24 MO and can be partly rescued in rps24 and p53 double MO at 48 hpf. (G-L) The expression of cmyb and runx1 was significantly decreased in rps24 MO and can be partly rescued in rps24 and p53 double MO at 48 hpf. EXPRESSION / LABELING:
PHENOTYPE:
|
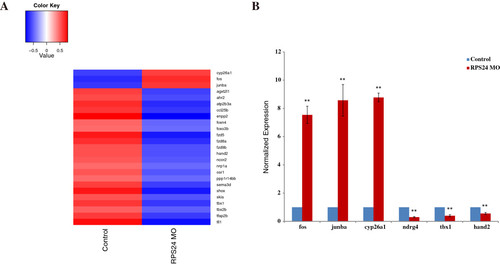
Differentially expressed hematological genes in RPS24 MO. (A) A total of 25 differentially expressed hematological genes (by fold-change >1.3 and p-value <0.05) were detected in RPS24-deficient zebrafish embryos in 48hpf. The expression intensity of these genes were normalized to (-1, 1) and represented as heat map by R script. (B) Representative experimental validation of the regulated genes by Real-time PCR analysis. Gene expression was represented as the mean ± SD and One-way ANOVA was performed for comparison between Control and RPS24-deficient zebrafish embryos (**P <0.001, *P <0.01, n = 3). Gene expression in Control samples was normalized to 1. EXPRESSION / LABELING:
|
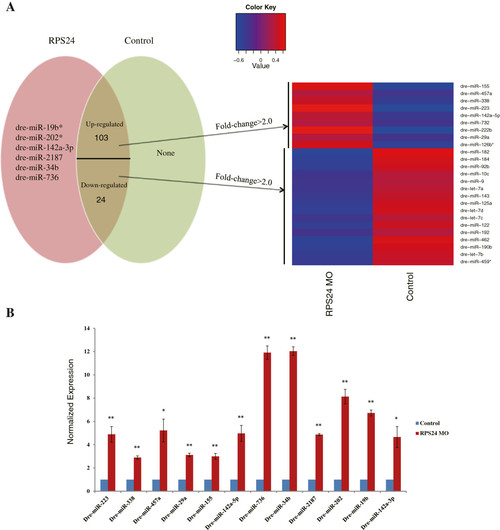
Differentially regulated known miRNAs. (A) Specific expressed miRNAs in RPS24 and Control are represented in the form of Venn diagrams. A subset of miRNAs that are differentially regulated by fold-change >2.0 and p-value <0.05 is in the overlapped area and their normalized expression levels can be seen in the heat map. (B) Representative experimental validation of the regulated miRNAs by Real-time PCR analysis. Gene expression was represented as the mean ± SD and One-way ANOVA was performed for comparison between Control and RPS24-deficient zebrafish embryos (**P <0.001, *P <0.01, n = 3). Gene expression in Control samples was normalized to 1. EXPRESSION / LABELING:
|