
- Title
-
Ncor1 and Ncor2 Play essential but distinct roles in zebrafish primitive myelopoiesis
- Authors
- Li, J., Li, K., Dong, X., Liang, D., Zhao, Q.
- Source
- Full text @ Dev. Dyn.

Abnormal development of myeloid cells in zebrafish ncor2 or ncor1 morphants at 24 hpf. A–G: mpx expression was detected by whole-mount in situ hybridization when embryos were microinjected with control MO (A), ncor2 MO (B), ncor1 MO (C), ncor2 mRNA (D), ncor2 mRNA plus ncor2 MO (E), ncor1 mRNA (F), and ncor1 mRNA plus ncor1 MO (G), respectively. H–L: mfap4 expression was detected by whole-mount in situ hybridization when embryos were microinjected with control MO (H), ncor2 MO (I), ncor1 MO (J), ncor2 mRNA (K), and ncor2 mRNA plus ncor2 MO (L), respectively. M: The scatter plot showing the number of mpx+ cells in the embryos microinjected with control MO, ncor2 MO, ncor2 mRNA, and ncor2 mRNA plus ncor2 MO, respectively. N: The scatter plot showing the number of mfap4+ cells in the embryos microinjected with control MO, ncor2 MO, ncor2 mRNA, and ncor2 mRNA plus ncor2 MO, respectively. O: The scatter plot showing the number of mpx+ cells in the embryos microinjected with control MO, ncor1 MO, ncor1 mRNA, and ncor1 mRNA plus ncor1 MO, respectively. P: The scatter plot showing the number of mfap4+ cells in the embryos microinjected with control MO and ncor1 MO, respectively. All embryos are pictured at 24 hpf. They were positioned anterior left and viewed laterally. |
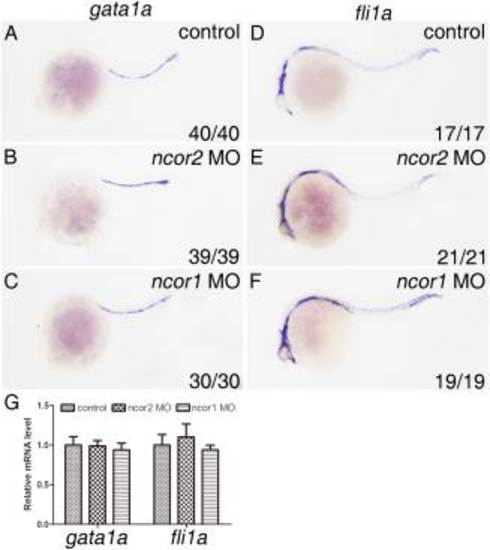
Both zebrafish ncor2 and ncor1 morphants display normal development of primitive erythroid cells and endothelial cells at 24 hpf. Embryos at one- to two-cell stage were microinjected with control MO (A,D), ncor2 MO (B,E), and ncor1 MO (C,F), respectively. Whole-mount in situ hybridizations were performed on the microinjected embryos at 24 hpf to examine expressions of gata1a (A–C) and fli1a (D–F), respectively. All embryos were positioned anterior left and viewed laterally. G: Quantitative real-time PCR was performed to confirm changes of expression levels of gata1a and fli1a in ncor2 and ncor1 morphants. Experiments were repeated three times. Results were subjected to Student′s t-test. EXPRESSION / LABELING:
|
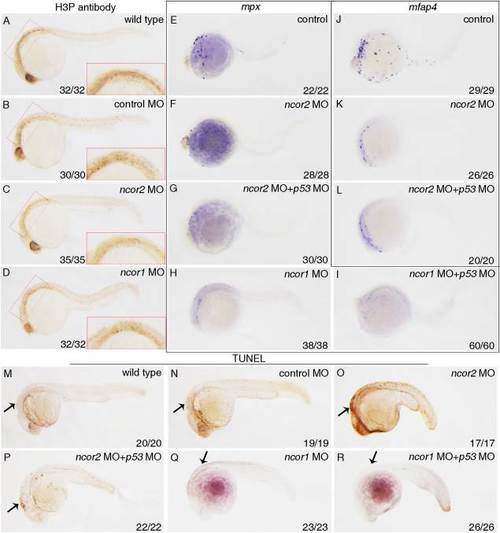
The developmental defects of myeloid cells in either ncor2 or ncor1 morphants are not attributed to cell proliferation or apoptosis. A–D: Cell proliferation was detected by whole-mount in situ immunohistochemistry using phosphohistone-H3 antibody in wild-type (A), control MO (B), ncor2 MO (C), and ncor1 MO (D) embryos at 24 hpf. The inserted panels shows the head regions of embryos at higher magnification. E–L: Preventing embryonic cells from apoptosis with p53 morpholino does not rescue the defects of primitive myelopoiesis in ncor2 or ncor1 morphants. The expression of mpx (E–I) or mfap4 (J–L) was detected by whole-mount in situ hybridization when microinjected with control MO (E,J), ncor2 MO (F,K), ncor2 MO plus p53 MO (G,L), ncor1 MO (H) and ncor1 MO plus p53 MO (I), respectively. M–R: Cell apoptosis was detected by TUNEL assay in wild-type (M), control MO (N), ncor2 MO (O), ncor2 MO plus p53 MO (P), ncor1 MO (Q) and ncor1 MO plus p53 MO (R) embryos 24 hpf. Embryos were positioned anterior left and viewed laterally. |
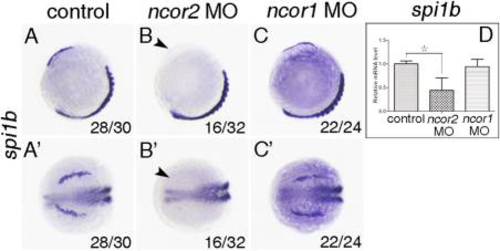
Zebrafish ncor2 but not ncor1 is essential for the development of spi1b+ cells in the embryos at 10-somite stage. A–C,A2–C2: Whole-mount in situ hybridization was performed (myoD: a marker to indicate the developmental stage) to examine the expressions of spi1b. Embryos were microinjected with control MO (A,A2), ncor2 MO (B,B2) and ncor1 MO (C,C2) respectively. Embryos were positioned anterior top and viewed laterally (A–C) or anterior left and viewed dorsally (A2–C2). Arrowhead indicates the decreased expression of spi1b in the RBI (B,B2). The number shown in the lower right-hand corner is the number of embryos exhibiting the typical phenotype shown in the panel to the number of embryos totally observed. D: qPCR was performed to confirm the changes of expression levels of spi1b in ncor2 and ncor1 morphants. Experiments were repeated three times. *P < 0.05. EXPRESSION / LABELING:
|
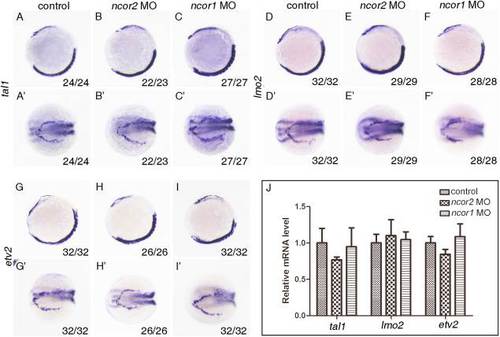
Neither zebrafish ncor2 nor ncor1 is required for expressions of early transcriptional factors tal1, lmo2, and etv2. A–I,A2–I2: Whole-mount in situ hybridization was performed on the embryos (myoD: a marker to indicate the developmental stage) to examine the expressions of tal1 (A–C,A′–C′), lmo2 (D–F,D′–F′) and etv2 (G–I,G′–I′). Embryos at the one- to two-cell stage were microinjected with control MO (A,A′,D,D′,G,G′), ncor2 MO (B,B′,E,E′,H,H′) and ncor1 MO (C,C′,F,F′,I,I′) and then grown to 10-somite stage, respectively. Embryos were positioned anterior top and viewed laterally (A–I) or anterior left and viewed dorsally (A′–I′). J: Quantitative real-time PCR was performed to confirm the relative expression level changes of tal1, lmo2, and etv2 in ncor2 or ncor1 morphants. Experiments were repeated three times. Results were subjected to Student′s t-test. EXPRESSION / LABELING:
|
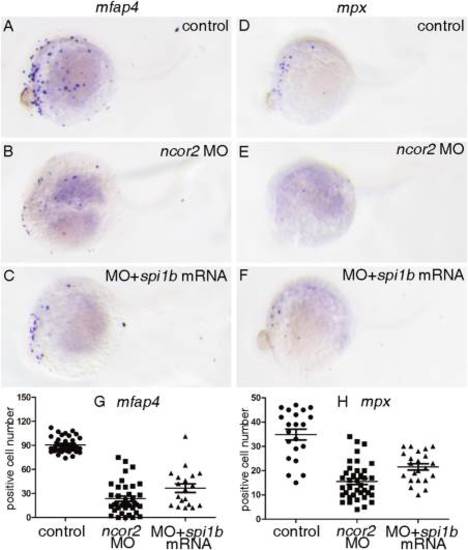
Overexpressing spi1b mRNA could rescue the depleted expression of mfap4 or mpx in ncor2 morphants at 24 hpf. A–F: Whole-mount in situ hybridization was performed to examine the expression of mfap4 (A–C) and mpx (D–F). Embryos were microinjected with control MO (A,D), ncor2 MO (B,E) and ncor2 MO plus spi1b mRNA (C,F), respectively. G: The scatter plot showing the number of mfap4+ cells in the embryos microinjected with control MO, ncor2 MO, and spi1b mRNA plus ncor2 MO, respectively. H: The scatter plot showing the number of mpx+ cells in the embryos microinjected with control MO, ncor2 MO, and spi1b mRNA plus ncor2 MO, respectively. |
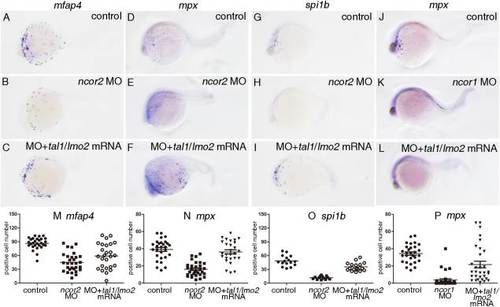
Overexpressing tal1/lmo2 mRNA could rescue the depleted myeloid cells in ncor2 or ncor1 morphants at 24 hpf. A–C: The expression of mfap4 was examined by whole-mount in situ hybridization. D–F,J–L: The expression of mpx was examined by whole-mount in situ hybridization. G–I: Whole-mount in situ hybridization was performed to examine the expression of spi1b. Embryos were microinjected with control MO (A,D,G,J), ncor2 MO (B,E,H), ncor2 MO plus tal1/lmo2 mRNA (C,F,I), ncor1 MO (K) and ncor1 MO plus tal1/lmo2 mRNA (L), respectively. M–O: Scatter plots showing the number of mfap4+ (M), mpx+ (N), or spi1b+ (O) cells in the embryos microinjected with control MO, ncor2 MO, and tal1/lmo2 mRNA plus ncor2 MO, respectively. P: Scatter plot showing the number of mpx+ cells in the embryos microinjected with control MO, ncor1 MO, and tal1/lmo2 mRNA plus ncor1 MO, respectively. |