
- Title
-
Valproic acid, a histone deacetylase inhibitor, regulates cell proliferation in the adult zebrafish optic tectum
- Authors
- Dozawa, M., Kono, H., Sato, Y., Ito, Y., Tanaka, H., Ohshima, T.
- Source
- Full text @ Dev. Dyn.
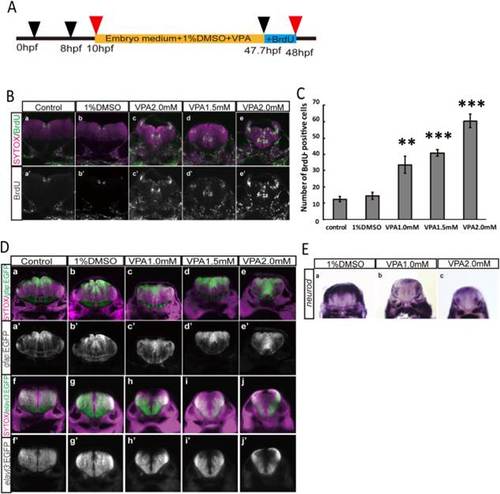
VPA increases proliferating cells in the hindbrain of embryonic zebrafish. A: Embryonic zebrafish were treated with 1.0, 1.5, 2.0 mM VPA from 10 to 48 hpf. In last 20 min, BrdU was added to label proliferating cells. B: Number of BrdU-positive cells increased in a dose-dependent manner, and the area of BrdU-positive cells expanded in the VPA-treated brain. C: Number of BrdU-positive cells per section. D: Tg(elavl3:GFP) and Tg(gfap:GFP) were treated with VPA at indicated concentrations, and the GFP-positive area was analyzed. Reduction of elavl3-GFP-positive area (a-e, a′-e′) and increase of gfap-GFP-positive area (f-j, f′-j′) were observed in VPA-treated zebrafish hindbrain. E: In situ hybridization of VPA-treated embryonic brain with neurod probes. Area of neurod-positive decreased in VPA-treated zebrafish hindbrain. After whole-mount in situ hybridization, coronal sections were made at rhombomere 5 or 6 of the hindbrain. |
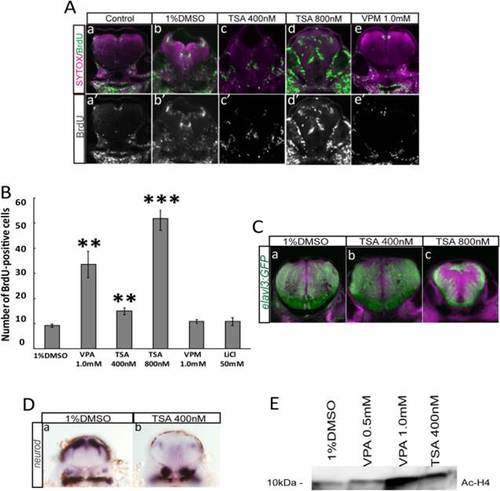
The HDAC inhibitor TSA mimics the effect of VPA on cell proliferation in embryonic zebrafish. A: TSA-treated brains were stained with anti-BrdU antibody. Number of BrdU-positive cells increased in a dose-dependent manner, and the area of BrdU-positive cells expanded in the TSA-treated brain. B: Number of BrdU-positive cells per section. C: Tg(elavl3:GFP) fish were treated with TSA. GFP-positive area decreased in the TSA-treated embryo, similar to the VPA-treated embryo. D: In situ hybridization of 400 nM TSA-treated embryos with neurod probe. Expression of neurod decreased in the TSA-treated brain. E: Acetylated histone H4 (Ac-H4) level was analyzed by Western blot analysis in brain homogenates from zebrafish embryos treated with indicated drugs. Increased Ac-H4 level was observed in 1.0 mM VPA and 400 nM TSA-treated samples. **P < 0.01, ***P < 0.001 |
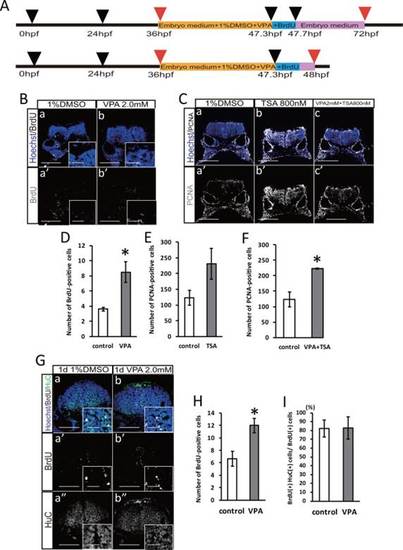
VPA administration does not relate to the promotion of neuronal differentiation. A: Timeline of drug treatment and BrdU labeling. B: Immunostaining with BrdU in the embryo zebrafish hindbrain with or without 2.0 mM VPA treatment. Scale bar = 100 µm, inset of 20 µm. C: Immunostaining with PCNA in the embryo zebrafish hindbrain with or without 2.0 mM VPA and 800 nM TSA treatment. Scale bar = 100 µm. D: Number of BrdU-positive cells with or without 2.0 mM VPA treatment (control: n = 5; VPA: n = 6). E: Number of PCNA-positive cells with or without 800 nM TSA treatment (P=0.12; control: n = 3; TSA: n = 3). F: Number of PCNA-positive cells with or without 2.0 mM VPA and 800 nM TSA treatment (control: n = 3; VPA+TSA: n = 3). G: Immunostaining with BrdU and HuC in the embryo zebrafish hindbrain with or without 2.0 mM VPA treatment. Scale bar = 100 µm, inset of 20 µm. H: The number of BrdU-positive cells (control: n = 3; VPA: n = 3). I: The percentage of BrdU and HuC double-positive cells in BrdU-positive cells (P=0.97; control: n = 3; VPA: n = 3). *P < 0.05. |
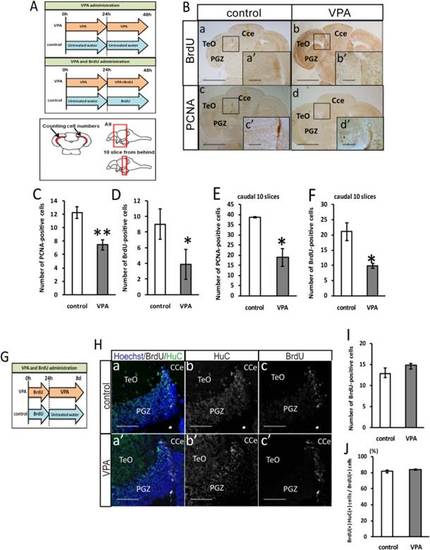
VPA decreases cell proliferation in the optic tectum of adult zebrafish. A: Timeline of drug treatment and method of quantification of cell number. B: Immunostaining with PCNA and BrdU in the dorsomedial area of the PGZ of the adult zebrafish optic tectum. Scale bar = 50 µm. C: The number of PCNA-positive cells (control: n = 3, VPA: n = 4). D: The number of BrdU-positive cells (control: n = 3; VPA: n = 4). E: The number of PCNA-positive cells in 10 caudal slices (control: n = 3; VPA: n = 4). F: The number of BrdU-positive cells in 10 caudal slices; 500 µM VPA treatment reduces the number of proliferating cells (control: n = 3; VPA: n = 4). G: Timeline of drug treatment. H: Immunostaining with HuC and BrdU in the PGZ of the adult zebrafish optic tectum. Scale bar = 100 µm. I: The number of BrdU-positive cells in 10 caudal slices (P = 0.26; control: n = 4; VPA: n = 3). J: The percentage of BrdU and HuC double-positive cells in BrdU-positive cells in 10 caudal slices. VPA administration does not relate to the promotion of neuronal differentiation (P = 0.32; control: n = 4; VPA: n = 3). CCe, corpus cerebelli; PGZ, periventricular gray zone; TeO, tectum opticum. **P < 0.01, *P < 0.05. |
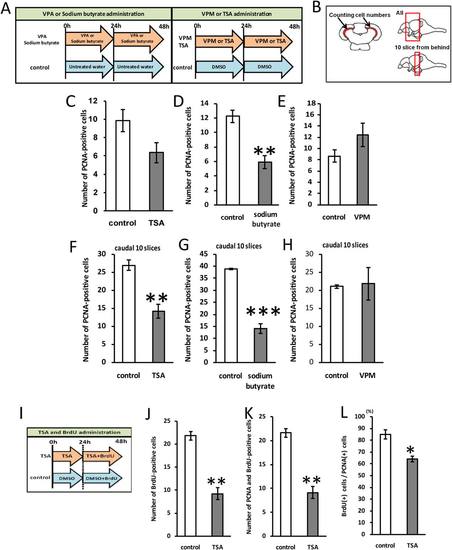
HDAC inhibition suppresses cell proliferation in the optic tectum of adult zebrafish. A: Timeline of drug treatment. B: Method of quantification of cell number. C: Number of PCNA-positive cells in the zebrafish optic tectum with or without 400 nM TSA treatment (P = 0.075; control: n = 4; TSA: n = 4). D: Number of PCNA-positive cells in the zebrafish optic tectum with or without 13.6 µM sodium butyrate treatment (control: n = 3; sodium butyrate: n = 3). E: Number of PCNA-positive cells in the zebrafish optic tectum with or without 100 µM VPM (VPA analog) treatment (P = 0.21; control: n = 4; VPM: n = 3). F: Number of PCNA-positive cells in 10 caudal slices (control: n = 4; TSA: n = 4). G: The number of PCNA-positive cells in 10 caudal slices. (control: n = 3; sodium butyrate: n = 3). H: The number of PCNA-positive cells in 10 caudal slices (P=0.88; control: n = 4; VPM: n = 3). I: Timeline of drug treatment. J: Number of BrdU-positive cells in 10 caudal slices (control: n = 3; TSA: n = 3). K: Number of BrdU and PCNA double-positive cells in 10 caudal slices (control: n = 3; TSA: n = 3). L: Percentage of BrdU and HuC double-positive cells in BrdU-positive cells in 10 caudal slices (control: n = 3; TSA: n = 3). ***P < 0.001, **P < 0.01, *P < 0.05. PHENOTYPE:
|
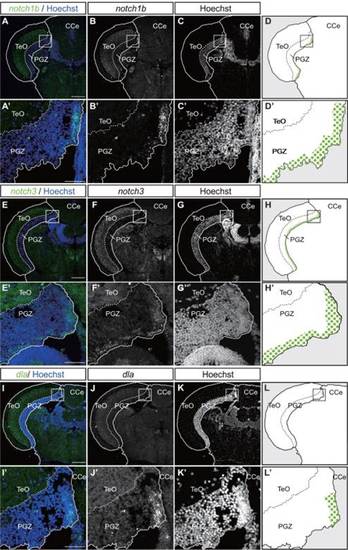
Expression pattern of Notch signal components in the optic tectum of adult zebrafish. Expression patterns of notch1b, notch3, and deltaA (dla) in transverse sections of the adult zebrafish optic tectum. Hoechst is for nuclear staining. Magnified views of the PGZ, indicated in the dorsomedial area of the PGZ. A-C, A′-C′: notch1b was strongly expressed in the medial margin and weakly expressed in deep layer of the PGZ. E-G, E′-G′: notch3 were expressed in the ventral margin and deep layer of the PGZ. I-K, I′-K′: and dla were expressed in the medial margin of the PGZ. Scale bar = 200 µm (A-K), 25 µm (A′-K′). CCe, corpus cerebelli; PGZ, periventricular gray zone; TeO, tectum opticum. EXPRESSION / LABELING:
|
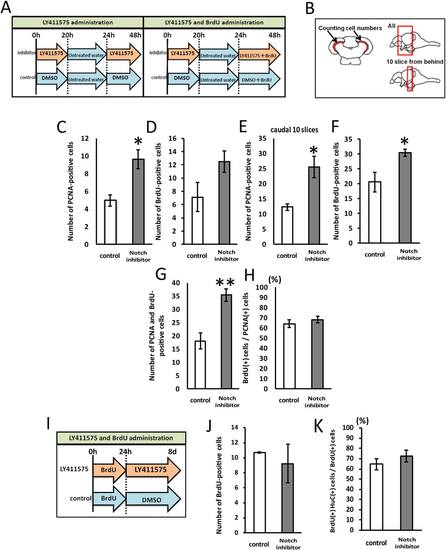
HDAC inhibitor upregulates Notch signaling, which suppresses cell proliferation in the optic tectum of adult zebrafish A: Timeline of drug treatment. B: Method of quantification of cell number. C: Number of PCNA-positive cells (control: n = 4; inhibitor: n = 8). D: Number of BrdU-positive cells (P = 0.098, control: n = 4; inhibitor: n = 4). E: Number of PCNA-positive cells in 10 caudal slices (control: n = 4; inhibitor: n = 8). F: Number of BrdU-positive cells in 10 caudal slices. Notch inhibitor LY411575 increased the number of proliferating cells (control: n = 4; inhibitor: n = 4). G: Number of BrdU and PCNA double-positive cells in 10 caudal slices (control: n = 5; inhibitor: n = 3). H: Percentage of BrdU and PCNA double-positive cells in PCNA-positive cells in 10 caudal slices; LY411575 did not affect the speed of cell cycle (P = 0.33; control: n = 5; inhibitor: n = 3). I: Timeline of drug treatment. J: Number of BrdU-positive cells from 10 caudal slices (control: n = 2; inhibitor: n = 2). K: Percentage of BrdU and HuC double-positive cells within the number of BrdU-positive cells in 10 caudal slices (control: n = 2; inhibitor: n = 2). **P < 0.01, *P < 0.05. PHENOTYPE:
|
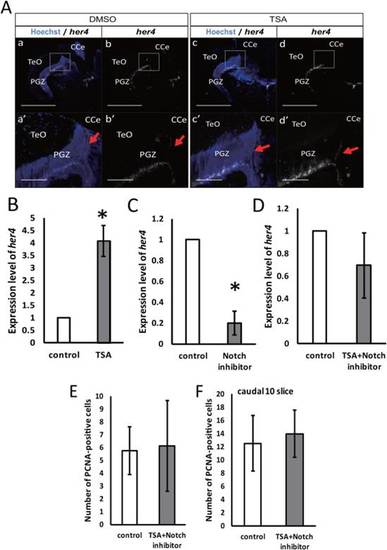
Notch inhibitor canceled the HDAC effect on cell proliferation in the optic tectum of adult zebrafish. A: Expression of her4 in transverse sections of the adult zebrafish optic tectum with or without 400 nM TSA treatment. Scale bar = 500 µm (a-d), 100 µm (a′-d′). CCe, corpus cerebelli; PGZ, periventricular gray zone; TeO, tectum opticum. B: Quantitative RT-PCR for her4 in the optic tectum of adult zebrafish with or without 400 nM TSA treatment. C: Quantitative RT-PCR for her4 in the optic tectum of adult zebrafish with or without 5 µM LY411575 treatment. D: Quantitative RT-PCR for her4 in the optic tectum of adult zebrafish with or without 500 µM VPA and 5 µM LY411575 treatment. E: Number of PCNA-positive cells in total slices (P = 0.89; control: n = 4; TSA + Notch inhibitor: n = 3). F: Number of PCNA-positive cells in 10 caudal slices (P = 0.81; control: n = 4; TSA + Notch inhibitor: n = 3). *P < 0.05. EXPRESSION / LABELING:
|