
- Title
-
Collective epithelial migration drives kidney repair after acute injury
- Authors
- Palmyre, A., Lee, J., Ryklin, G., Camarata, T., Selig, M.K., Duchemin, A.L., Nowak, P., Arnaout, M.A., Drummond, I.A., Vasilyev, A.
- Source
- Full text @ PLoS One
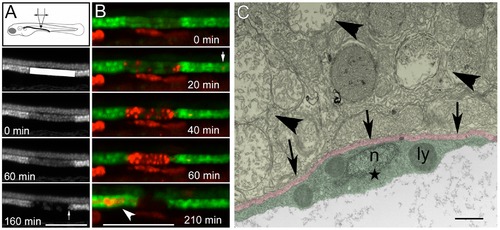
405 nm laser ablation induces kidney specific segmental epithelial injury in GFP transgenic zebrafish. (A) 12 dpf zebrafish was subjected to 405 nm laser treatment using a confocal microscope. The plane of maximal illumination was guided by kidney GFP fluorescence (here- E11-9 transgenic fish). The laser scan window is shown by the white rectangle. Efficient laser treatment was monitored by observing GFP bleaching in the ablated area (with a target of ~50% initial reduction in GFP fluorescence). The ablated segment continued to lose GFP positivity with only an occasional cell surviving at 160 min post- laser treatment. The arrow points to a sharply defined edge of surviving epithelium. Scale bar = 70 μm. (B) Propidium iodide (PrI, red) staining confirmed that loss of GFP positivity was due to cell death, as opposed to other mechanisms. As cells in the injured segment lost GFP positivity, they became strongly PrI-positive. Every cell showed PrI positivity by 60 min post injury, and by 210 min PrI-positive material was seen exclusively in the distended lumen proximal to the obstructed segment (lower panel). PrI-positive material could also be seen transiting through the distal tubule (arrow in 20 min panel). Scale bar = 100 μm. (C) Electron microscopy of the injured epithelium 3 hours post-laser treatment shows compacted swollen degenerated mitochondria (arrowheads). The basement membrane (pink, arrows) and the adjacent, likely stromal or endothelial cell (green, star) is preserved. “n” – intact nucleus, “ly” – lysosome. Scale bar = 1000 nm. |
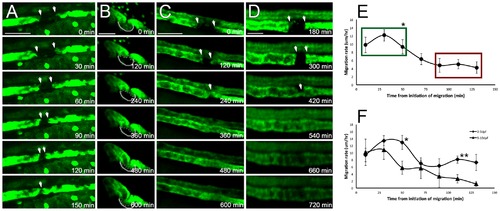
Surviving kidney epithelium responds by collective migration. Various kidney GFP transgenics were examined by time lapse confocal microscopy at different developmental stages. (A) Proximal tubule epithelium (ET33d10 transgenic, 2.5 dpf), after segmental ablation of the proximal tubule, shown in 30 min intervals. Scale bar –60 μm. (B) Proximal convoluted tubule epithelium (ET33d10 transgenic, 6 dpf), after segmental ablation of the proximal tubule, shown in 120 min intervals. Scale bar –60 μm. (C, D) Distal tubule epithelium (ET11-9 transgenic) after segmental photoablation shown in 120 min intervals in 7 dpf (C) and 5 dpf (D) fish. (D) shows marked obstructive dilatation of tubule epithelium, some of which is also seen in (C). This is a commonly observed phenomenon. Scale bars: (C) - 60 μm, (D) - 30 μm. (E) Migration rates as a function of time after the initiation of the migratory response. The rates are maximal right after the initiation of the migration and decrease over a few hours. The three early time points (green box) show statistically significant difference from the three late time points (red box, p<0.01, n = 10). The initial migration rates are similar in young (2–3 dpf) fish and older (> = 5 dpf) fish (p = 0.84), but the rates appear to persist longer in younger fish. Statistically significant differences between the rates can be seen at 50 min (p = 0.02, n = 5,5) and 110 min (p<0.01, n = 5,5) time points, as shown in (F). |
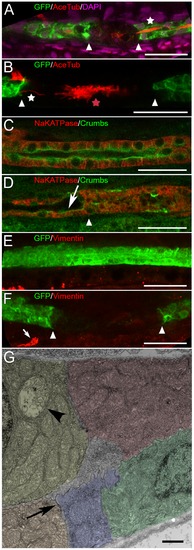
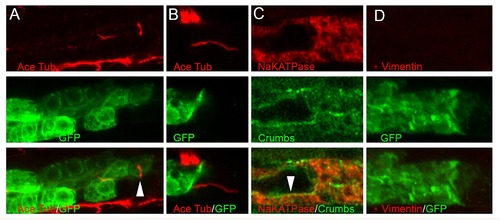
Regenerating epithelia remain differentiated. Kidney epithelium is shown at 4–6 hours post injury (hpi), on the site of the laser ablation. (A, B): Anti-GFP (green), anti-acetylated-tubulin (red) and DAPI (magenta, A) staining of the injured tubule shows that cilia and cilia bundles (multiciliated cell in A) are present at the edge (white arrowheads, also Figure S4) of surviving epithelium (white star in A and B). The aggregated cilia bundles in B (red star) are visible in the middle of the injured segment (between arrowheads). (C and D): Na/K ATPase (red) and Crumbs (green) expression in intact (C) and injured (D) epithelium (also Figure S4). AKI does not affect the expression of Crumbs on the apical surface of surviving cells (D, arrow), while its distribution is randomized in the injured segment (right of the arrowhead in D, which marks the border between the intact and the injured segment. (E, F): Vimentin is not expressed in intact kidney epithelium (E) and is not up-regulated after acute injury (F, also Figure S4). Vimentin staining can be seen outside of the kidney (arrow in (F)). Bar lengths in (A-F) are 30 µm. (G) Electron microscopy of a longitudinal section at the edge of surviving epithelium (the edge itself is not shown, to the left). Apical junctional complexes (arrow) are preserved. Bar length is 1 μm. One degenerated mitochondrion indicates partial injury to the cell at the edge of the injury (arrowhead). Different colors are used to delineate individual epithelial cells. The virtual slice thickness in (A-F): A- 1.4 μm; B-5.6 μm (7 slices); C,D- 1.4 μm; E- 7.0 μm (8 slices); F- 11.2 μm (15 slices). |
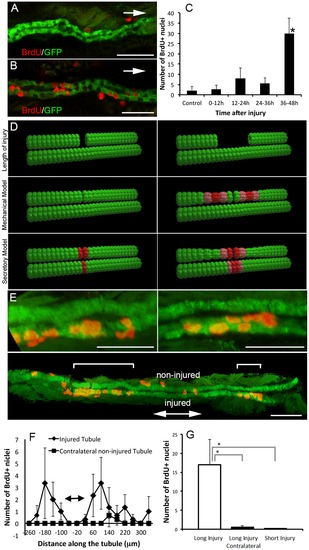
Kidney epithelial proliferation after acute injury. (A,B) Two examples of BrdU staining after segmental ablation early (0–12 hpi, A) and late (36–48 hpi, B) in ET11-9 GFP transgenic fish. Arrows indicate the direction of injury. Confocal slice thickness is 1.5 μm in (A), and 1.6 μm in (B). (C) Number of BrdU+ cells at various intervals after segmental laser ablation (0–12 hpi, n = 4, 12–24 hpi, n = 3, 24–36 hpi, n = 4, 36–48 hpi, n = 4) and compared to non-injured control condition (n = 8). There was no significant increase in cell proliferation early in the repair process (up to 36 hpi) but a pronounced increase in cell proliferation first detectable between 36 and 48 hpi, compared to control condition (p<0.05, C). (D) Two possible mechanisms that could trigger cell proliferation (mechanical stretch due to cell migration vs. a secretory factor) lead to different predictions about the distribution of cell proliferation after segmental ablation. Red color indicates the predicted distribution of cell proliferation after short (left panel) vs. long (right panel) tubule segment ablation. Upper row: initial injury; middle row: stretch response scenario (mechanical model). Lower row: secretory factor scenario. (E) Long segmental ablation resulted in two distinct bands of BrdU incorporation both upstream (left and lower sub-panels) and downstream (right and lower sub-panels, each sub-panel represents a confocal projection image). Brackets in the lower sub-panel indicate bands of proliferation upstream and downstream of the injury. The right and left upper sub-panels show a higher magnification of the areas of proliferation marked by brackets in the lower sub-panel. Other BrdU+ nuclei are outside of the kidney. (F) Comparison of BrdU incorporation in the injured (rhombi) vs. contralateral non-injured tubule (squares). This pattern of BrdU incorporation is most consistent with the mechanical model of the cell proliferation trigger. Double-arrow bar indicates the approximate site of injury. (G) Total number of BrdU+ nuclei after long (80–100 μm) vs. short (20 μm) segmental ablation (24–48 hpi). Long segmental ablation resulted in significantly increased number of BrdU+ cells compared to a contralateral non-injured side (as well as kidney epithelium after short injury or in a non-injured control). Long injury vs. contralateral non-injured tubule: p = 0.039, long injury vs. short injury: p = 0.048, n = 3 per each condition. Scale bars in (A,B and E upper sub-panels) = 30 μm, and 60 μm in (E, lower sub-panel). |
Epithelial and mesenchymal markers in injured epithelium. (A, B) Apical cilia at the edge of surviving epithelium. Upper panel – acetylated tubulin, middle panel – GFP, lower panel – combined. Panel (B) corresponds to figure 3B. (C) Higher magnification images corresponding to figure 3D. Upper panel – acetylated tubulin, middle panel – GFP, lower panel – combined. (D) Higher magnification images corresponding to figure 3F. Upper panel – acetylated tubulin, middle panel – GFP, lower panel – combined. |