
- Title
-
EXOSC8 mutations alter mRNA metabolism and cause hypomyelination with spinal muscular atrophy and cerebellar hypoplasia
- Authors
- Boczonadi, V., Müller, J.S., Pyle, A., Munkley, J., Dor, T., Quartararo, J., Ferrero, I., Karcagi, V., Giunta, M., Polvikoski, T., Birchall, D., Princzinger, A., Cinnamon, Y., Lützkendorf, S., Piko, H., Reza, M., Florez, L., Santibanez-Koref, M., Griffin, H., Schuelke, M., Elpeleg, O., Kalaydjieva, L., Lochmüller, H., Elliott, D.J., Chinnery, P.F., Edvardson, S., Horvath, R.
- Source
- Full text @ Nat. Commun.
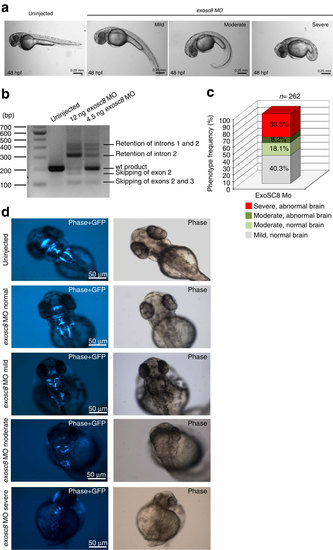
(a) Morphology of live embryos at 48 hpf injected with 12 ng splice-blocking exosc8 antisense MO at the 1–2 cell stage. From left to right: un-injected control embryo, exosc8 MO injected mild, moderate and severe phenotype, respectively. Mild phenotype: slightly curved tail; moderate phenotype: C-shaped; severe category: abnormally formed, very short tail, cardiac oedema, and small, misshapen or missing eyes. (b) RT–PCR analysis: analysis of exosc8 transcripts from embryos injected with the splice-blocking exosc8 MO which targets the splice donor site of exon 2. Using primers in exons 1 and 4, RT–PCR yielded several additional bands in MO injected embryos originating from mis-spliced transcripts. Wild-type transcript is still present in embryos injected with 4.5 ng of MO, but only a trace of wild-type product is left in embryos injected with 12 ng of MO, therefore 12 ng of MO was used in subsequent experiments. wt, wildtype. (c) Relative distribution of the exosc8 morphant phenotypes described above. External morphology described in a and cranial nerve abnormalities displayed in panel d are both taken into account in this categorization; exosc8 MO was injected in three independent experiments into embryos of the Tg(islet-1:GFP) strain and a total of 262 MO injected embryos were evaluated by light and fluorescent microscopy. (d) Brain abnormalities of exosc8 morphants (Tg(islet-1:GFP) strain) from the different phenotypes at 48 hpf: dorsal views of GFP positive neurons in the midbrain and the hindbrain. These transgenic zebrafish embryos express GFP in cranial motor and sensory neurons and in the efferent neurons for the lateral line and the vestibule-acoustic nerves. Normal cranial neuron structure and development was detected in embryos of the normal and mild category. Disrupted neuronal structure in the severe and in a proportion of the moderate categories; GFP positive cells are scattered, no clear structures are visible and overall GFP expression is reduced. PHENOTYPE:
|
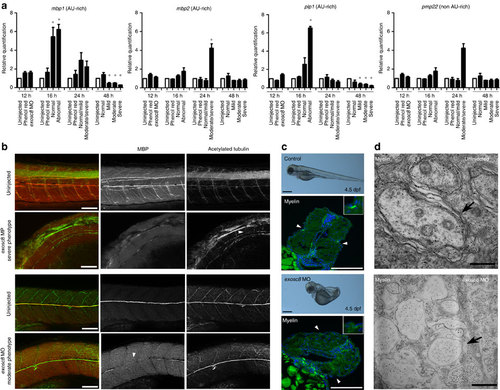
(a) exosc8 MO injected larvae were analyzed for expression of AU-rich mRNAs during 48 hpf by real-time PCR. At 16 hpf expression of mbp1 and plp1 was increased in embryos with an abnormal phenotype, with a similar increase in mbp2 observed at 24 hpf. Despite this initial increase, by 48 hpf there is a dramatic decrease in mbp1 and plp1 expression in larvae with a moderate and severe phenotype. Each bar or severity group at different timepoints represents a number of 15–20 embryos. Statistically significant changes (P<0.05) are marked with *. Unpaired t-test was used for statistical analysis. Error bars represent s.d. of three experimental repeats. (b) Un-injected control larvae and exosc8 MO injected larvae were analyzed for myelination at 96 hpf. Larvae were stained with antibodies against the zebrafish MBP and against acetylated tubulin. Left column: overlay, MBP staining in red, acetylated tubulin staining in green; middle column: MBP staining; right column: acetylated tubulin. Top row: tail of control larva: motor axons in each somite are clearly visible and myelinated at 96 hpf. Second row: tail of MO injected larva with a moderate phenotype: the spinal cord is curved and has an irregular structure. Motor axons in the somites are either very short (arrowhead) and thin or missing completely and are not MBP-positive. Third row: un-injected control larva, posterior lateral line, intact myelin. Bottom row: exosc8 MO injected larva with moderate phenotype: the lateral line is present (green acetylated tubulin signal) but the myelination of its neurons is interrupted (arrowhead). Scale bar, 100 μm. (c) Myelin staining of the lateral line was studied in control un-injected and exosc8 MO injected zebrafish larvae at 4.5 dpf. Representative images of the analyzed embryos are shown on the top (scale bar, 0.25 mm) and transverse sections of the embryos are shown on the bottom. In the control larvae the myelinated lateral line is present at both sides (white arrowheads). However, no myelination of the lateral line was detected in the exosc8 MO injected larvae (white arrowheads). Higher magnifications are shown in the upper right hand corners. Scale bar, 100 μm. (d) Representative EM pictures of the myelin sheath at the lateral line in un-injected and exosc8 MO injected zebrafish larvae at 4 dpf. Black arrows indicate the myelin sheet around the axon. Scale bar, 500 μm. EXPRESSION / LABELING:
PHENOTYPE:
|
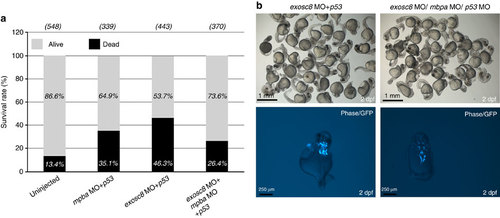
(a) Representative graph shows the survival rate of un-injected, mpba+p53, exosc8+p53 and combined mbpa+exosc8+p53 MO injections of the Tg(islet-1:GFP) strain at 48 hpf (summary of 3 experiments). The survival rate increased after triple MO injections compared with exosc8+p53 knockdown embryos. (b) Top row: morphology of the severe embryos at 48 hpf injected with exosc8+p53 and exosc8+mbpa+p53. Bottom row: brain abnormalities of exosc8+p53 and exosc8+mbpa+p53 morphants (Tg(islet-1:GFP) strain) at 48 hpf. Dorsal views of GFP positive neurons in the midbrain and the hindbrain indicate abnormal brain structures in severe exosc8+p53 morphants. Improved cranial neuron structure was detected in severe mbpa+exosc8+p53 MO injected embryos. The same result has been reproduced in three separate experiments with equal MO doses, on the same clutch of embryos. PHENOTYPE:
|
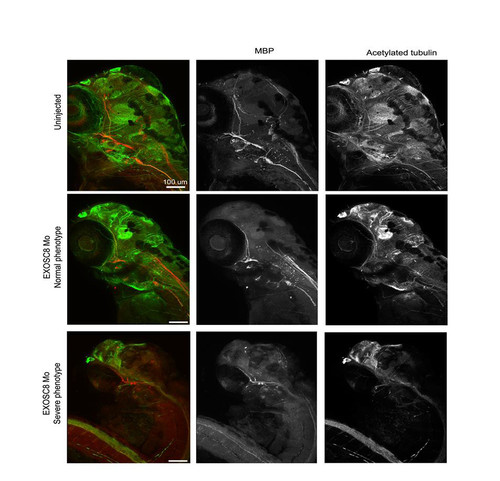
Mbp and acetylated tubulin staining after knock-down of the zebrafish orthologue, exosc8 in the head Un-injected control larvae and exosc8 MO injected larvae were analysed for myelination at 96 hpf. Larvae of the different phenotype categories and control larvae were stained with antibodies against the myelin basic protein (Mbp) and against acetylated tubulin to study the presence of axon tracts and their degree of myelination. Left column: overlay, with Mbp staining in red and acetylated tubulin staining in green; middle column: Mbp staining; right column: acetylated tubulin. Top row: head of control larva. Middle row: MO injected larva with normal external morphology; axons near the eye are not Mbp-positive (white arrowhead). Bottom row: MO injected larva with a severe phenotype. |

Unillustrated author statements PHENOTYPE:
|