
- Title
-
Zebrafish reporter lines reveal in vivo signaling pathway activities involved in pancreatic cancer
- Authors
- Schiavone, M., Rampazzo, E., Casari, A., Battilana, G., Persano, L., Moro, E., Liu, S., Leach, S.D., Tiso, N., Argenton, F.
- Source
- Full text @ Dis. Model. Mech.
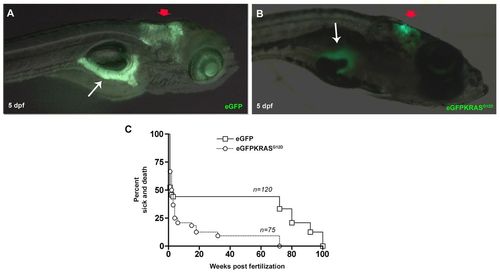
Tissue specificity expression of eGFP and eGFP-KRASG12D under control of ptf1a promoter and Kaplan–Meier analysis. (A,B) Lateral views, anterior to the right showing that EGFP (A) and eGFP-KRASG12D (B) are specifically expressed in cerebellum (red arrows) and pancreas (white arrows) of larvae observed at 5 dpf. (C) Kaplan–Meier analysis of dead or severely sick animals revealed lethality for about 92% of Tg(ptf1a:Gal4)/UAS:eGFP-KRASG12D as measured at 24 wpf. Differences between Tg(ptf1a:eGFP) and Tg(ptf1a:Gal4)/UAS:eGFP-KRASG12D were statistically significant with P<0.05. Number of sample for each group are indicated. EXPRESSION / LABELING:
|
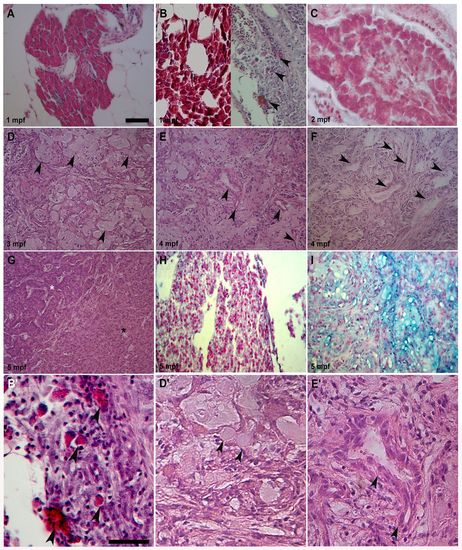
Different pancreas transformations induced by KRASG12D. (A) Control exocrine pancreas characterized by organized acinar clusters surrounded by fat cells and ducts. (B, left; C). Pre-tumoral acinar hyperplasia induced by KRASG12D seen in 6 out of 16 analyzed samples at 1 and 2 mpf. Acinar tissue extension over the entire exocrine pancreas replaced the ductal ephitelium. (B, right) Pre-tumoral fibrotic pancreas tissue with stromal enrichment, reactive ducts and a few acinar cells (arrowheads) interspersed inside disorganized exocrine tissue was seen in 10 out of 16 collected samples. (D) End-stage mucinous pancreatic adenocarcinoma of acinar origin with goblet cells (arrowheads) interspersed into exocrine tissue. (E) End-stage mucinous pancreatic adenocarcinoma with reactive ducts (arrowheads), increasing stroma and goblet cells. (F) End-stage mucinous adenocarcinoma with reactive ducts losing their morphology (arrowheads), stromal enrichment and disorganization of acinar tissue. (G) End-stage pancreatic adenocarcinoma with mixed acinar/ductal features showing an expansion of acinar tissue (black asterisk), its disorganization and duct hyperactivity (white asterisk). (H) Control exocrine pancreas Alcian Blue-negative samples showing organized acinar and duct structure. (I) End-stage mucinous Alcian Blue-positive pancreatic adenocarcinoma with goblet cells and small duct-like structures interspersed in a disorganized acinar tissue. Tumors shown in D, E, F and I were seen in 7 out of 15 analyzed samples between 3 and 5 mpf. Tumor shown in G was seen in 8 out of 15 analyzed samples between 3 and 5 mpf. (B2,D2,E2) More detailed magnifications of B (right), D and E. Arrowheads indicate acinar cells in B2, goblet cells in D2 and duct-like structures in E2. Age of analyzed samples is indicated. Scale bars: 50 μm. |
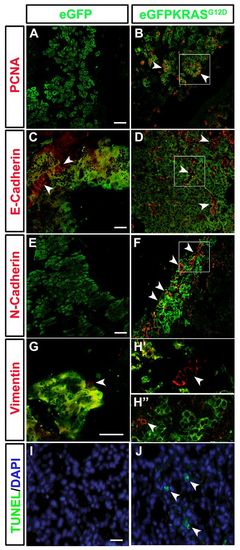
Cell hyperproliferation, EMT and apoptosis induction during pancreatic cancer. Markers of EMT (E-Cadherin, N-Cadherin and Vimentin), cell proliferation (PCNA) and apoptosis were assessed by immunohistochemistry on pancreatic tissue of both control Tg(ptf1a:eGFP) and tumor-prone Tg(ptf1a:Gal4)/UAS:eGFP-KRASG12D lines. (A,B) The cell proliferation marker PCNA (white arrowheads) is increased in tumor-prone fish (B) compared with controls (A). Cropped image evidenced by white square is reported in supplementary material Fig. S3B2. (C,D) No differences in E-Cadherin (white arrowheads) expression was shown between pancreas of tumor-prone fish (D) compared with controls (C). Cropped image evidenced by white square is reported in supplementary material Fig. S3D2. (E,F) N-Cadherin (white arrowheads) is highly expressed in Tg(ptf1a:Gal4)/UAS:eGFP-KRASG12D fish (F) whereas it is almost absent in controls (E). Cropped image evidenced by white square is reported in supplementary material Fig. S3F2. (G–H3) A slight increase in Vimentin expression (white arrowheads) was seen in both tumor mass and stroma of Tg(ptf1a:Gal4)/UAS:eGFP-KRASG12D fish (H2,H3) whereas it resulted low expressed in controls (G). Apoptosis level was higher in tumor-prone fish (J) than in controls (I) as indicated by white arrowheads in J. Analyses were performed on 7 tumor and 7 control samples. All samples were analyzed at 3 mpf. Scale bars: 100 μm. |
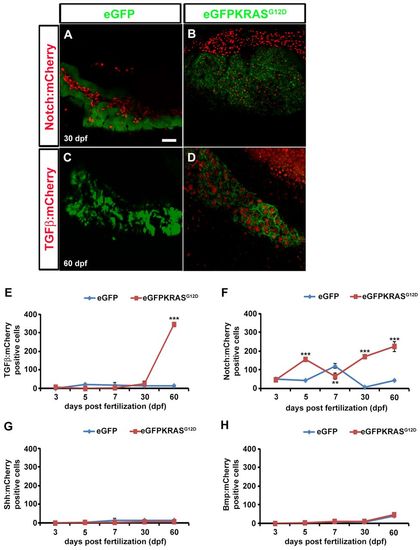
TGFβ, Notch, Shh and Bmp signaling activities during pancreatic cancer onset. TGFβ, Notch, Shh and Bmp signaling activities were evaluated by observing mCherry expression using confocal microscope analysis. (A–D) Pictures of full Z-stacks from 30 and 60 dpf samples. Controls obtained by outcrossing the Tg(ptf1a:eGFP) zebrafish line with TGFβ (A) and Notch (C) mCherry reporter lines. TGFβ (B) and Notch (D) signaling activity in tumor lines. (E–H) Quantitative analysis of eGFP-KRASG12D-positive cells expressing TGFβ (E), Notch (F), Shh (G) and Bmp (H) mCherry reporters by VOLOCITY 6.0 software. For each time point, 10 eGFP-positive samples were analyzed. Results for TGFβ (E) and Notch (F) signaling were statistically significant. Error bars indicate s.e.m. for all analyzed samples; **P<0.01, ***P<0.005 according to ANOVA test. EXPRESSION / LABELING:
|
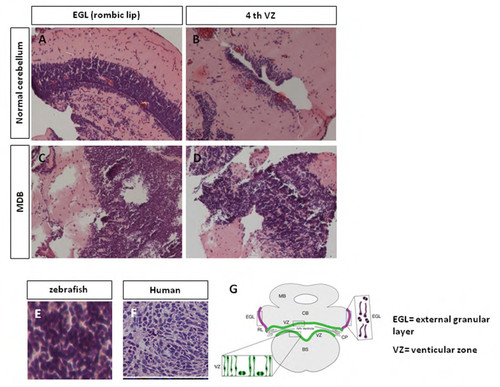
KRASG12D overexpression in zebrafish cerebellum induces medulloblastoma (MDB). A-D: Appearance of EGL (A) and 4th VZ (B) in normal cerebellum; zebrafish injected with KRASG12D develop early cerebellar lesions (C,D), which resemble medulloblastoma, starting from 15 dpf. E, F: Analysis of the histological features in 1 mpf zebrafish cerebellum reveals tumour masses (E) that resemble the classic type of human medulloblastoma (F) with sheets of small round blue cells with scant cytoplasm. (G) Schematic representation of a normal cerebellum, with EGL and VZ locations. |
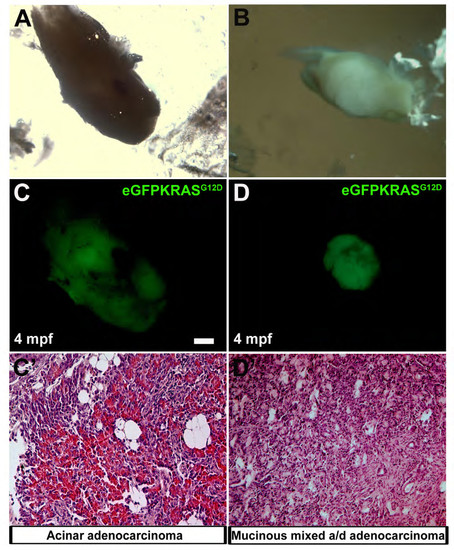
Different types of pancreatic cancers. In the panels A and B are reported brightfield images of two different excised pancreatic tumors at 4 months post fertilization. In the panels C and D are reported the relative eGFPKRASG12D positive tumor masses. Two masses corresponded to different types of pancreatic adenocarcinomas: acinar adenocarcinoma with altered structure of exocrine tissue (C′) and mucinous mixed acinar/ductal (a/d) adenocarcinoma (D′). Scale bar is 50 μm. |
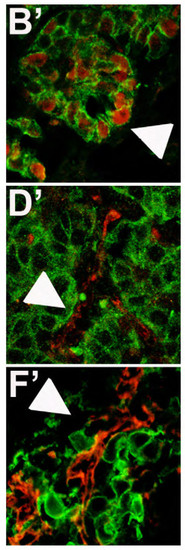
Cropped images evidenced in white squares of Fig.3 for PCNA (B′), E-Cadherin (D′), N-Cadherin (F′) expression in eGFP positive tumor masses. |
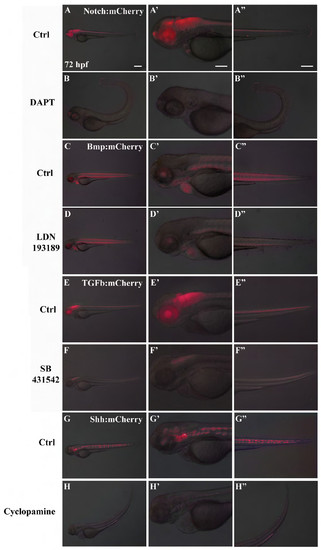
Validation of mCherry reporter expression. mCherry was expressed under control of ID1 (Bmp signaling); Smad3 (TGFβ signaling); Gli1 (Shh signaling) and Rbpj (Notch signaling). Panels report embryo analysis at 72 hpf for both treated and untreated embryos. Notch signaling is expressed in entire neural tube, pineal gland, eyes, cardiac valves and tail (A-A′′); Bmp signaling is expressed in muscle fibers, eyes, gill arches, heart (C-C′′); TGFβ signaling is expressed in neural tube except midbrain and forebrain and eyes (E-E′′); Shh signaling is expressed in nothocord, midbrain, hindbrain and eyes (G-G′′). Embryos were treated with specific pathways inhibitors: DAPT for Notch signaling (panels B-B′′), LDN193189 for Bmp signaling (panels D-D′′), SB431542 for TGFβ signaling (panels F-F′′), Cyclopamine for Shh signaling (panels H-H′′). A′-H′ and A′′-H′′ are magnifications of A-H. Scale bar is 50 μm for all pictures. Images are representative. Even considering the initial variability of reporter expression, we could observe significant reduction (more than 75%) of the fluorescence in all embryos analyzed for each reporter line treated with specific inhibitors (n>100/line). |

Role of TGFβ and Shh pathways during cancer progression. Panels A and C represent the Tg(ptf1a;eGFP) controls while panels B and D represent eGFPKRASG12D positive tumor masses. High levels of TGFβ:mCherry expression in the stroma around pancreatic tumor mass at 4 mpf are depicted in panel (B). Shh:mCherry is highly expressed in cerebellum at 14 dpf (D). All figures are single confocal Z-stack planes. Normal tissues and tumor masses are in green, while activity of Shh and TGFβ are in red. Scale bar is 50 μm. |
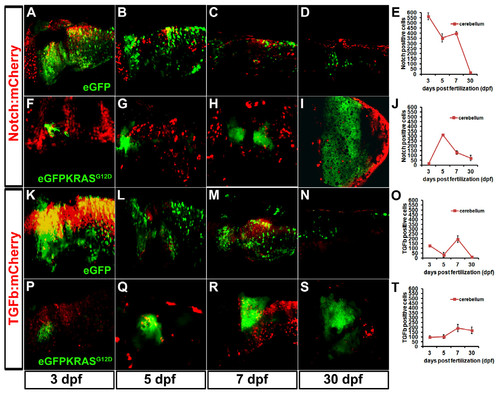
Role of Notch and TGFβ pathways during MDB onset and progression. Confocal analysis was performed to dissect the role of Notch and TGFβ pathways during MDB development. A-D: activity of Notch signaling pathway (red signals) in normal cerebellum (in green). E: Graph displaying the strong decrease of Notch:mCherry signal during development. F-J: inhibition of canonical Notch pathway (red signals) during MDB onset (3 - 7 dpf; F-H) and very low activity during MDB progression (30 dpf; I), as depicted also in graph (J), in parallel with the strong enlargement of eGFPKRASG12D tumor masses (green signals). Panels K-N display the activity of TGFβ signaling pathway (red signals) in MDB-free conditions. The alternating behavior of TGFβ:mCherry reporter line is depicted in graph (O). P-T: Increase of TGFβ signaling pathway (red signals) in MDB onset (3–7 dpf; P-R) and its involvement during MDB progression (S), as also depicted in graph T. Scale bar in all images is 50 μm, as reported in panel A. T student analysis showed P < 0.005, indicating that differences between MDB and control samples are statistically significant. Error bars are reported in each graph. Results in E, J, O, T are reported as eGFP/mCherry positive cell number. |
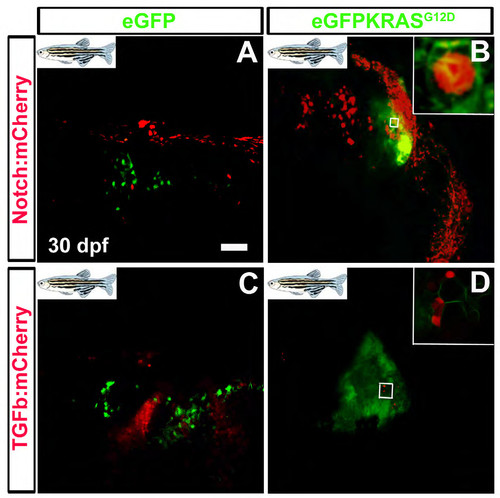
KRAS positive cells expressing Notch and TGFβ signaling reporters during MDB progression. Confocal zoom was performed on cerebellum tissue to observe the activity of TGFβ and Notch pathways at single-cell level. Normal (A and C) and Hyperplastic cerebella (B and D) are depicted, with scale bars for original (50 μm; A, B, C, D). The evidenced enlargement in panel B shows KRAS dependent activity of TGFβ pathway in MDB (tumor-prone green cells are also red reporter-positive). The enlargement in panel D shows KRAS dependent activity of Notch pathway in MDB (tumor-prone green cells are also red reporter-positive). Both pathways appear simultaneously involved in different ways during MDB onset and progression. |