
- Title
-
Zebrafish Noxa promotes mitosis in early embryonic development and regulates apoptosis in subsequent embryogenesis
- Authors
- Zhong, J.X., Zhou, L., Li, Z., Wang, Y., Gui, J.F.
- Source
- Full text @ Cell Death Differ.
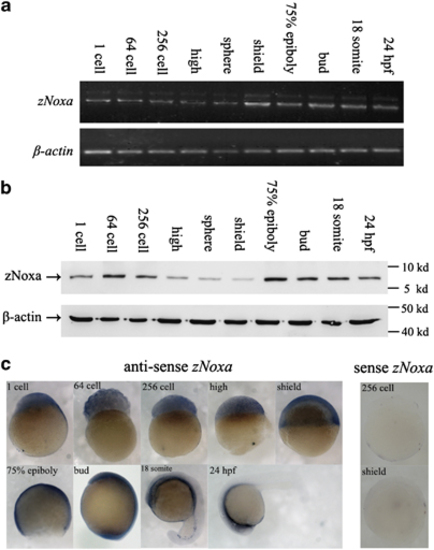
Expression of zebrafish Noxa (zNoxa) during embryogenesis. (a) Transcription of zNoxa in embryonic development stages was detected by semi-quantitative RT-PCR and normalized to β-actin transcript. (b) The extracted proteins from different stage embryos were subjected to western blot detection by the mouse polyclonal antiboies against zNoxa-mature protein and β-actin, respectively. (c) Expression pattern of zNoxa was detected by in situ hybridization using specific antisense or sense probes. No staining was present in embryos hybridized with sense probe (256 cell and shield representative stages shown). Embryo in ‘24 h.p.f.’ panel was lateral view, with dorsal toward the top and anterior to the left. The embryos in other panels were lateral views with animal pole toward the top and dorsal to the right. |
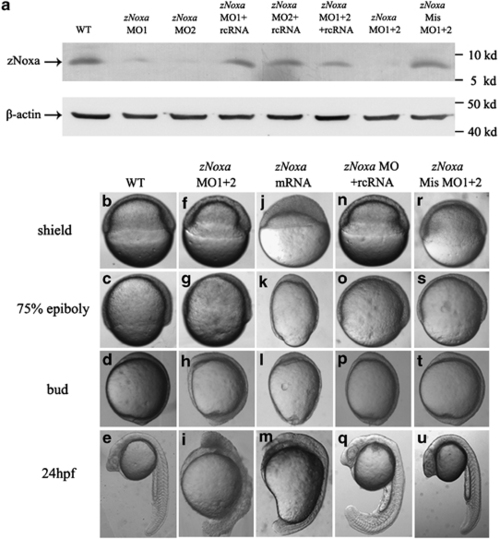
Altered expression of zNoxa results in deformed embryos. (a) Protein was extracted from embryos at the shield stage and 30 µg of each sample was immunoblotted for zNoxa and β-actin. β-Actin served as an internal control. (b-u) The WT embryos (b-e), the zNoxa MO1+2-injected embryos (f-i), the zNoxa mRNA-injected embryos (j-m), the zNoxa MO1+2 plus rcRNA-injected embryos (n-q) and the zNoxa mismatch MO1+2-injected embryos (r-u) were shown at shield stage, 75% epiboly stage, bud formation stage and 24 h.p.f. WT and the injected mismatch-MO embryos were identical in appearance. Lateral views of embryos at shield and 75% epiboly stages, animal pole toward the top and dorsal to the right. Lateral views of embryos at bud and 24 h.p.f. stage, antetior toward the top and dorsal to the right |
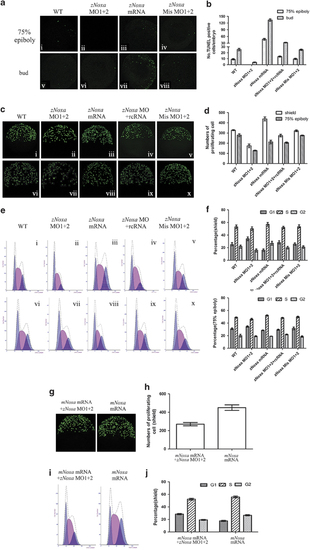
zNoxa controls mitosis and apoptosis during early embryogenesis. (a) Confocal z-stacks of apoptotic cells assessed by TUNEL in embryos which were WT (i, v) and injected with zNoxa MO1+2 (ii, vi), zNoxa mRNA (iii, vii) or zNoxa mismatch MO1+2 (iv, viii) at 75% epiboly and bud stages. Embryos were lateral views with animal pole toward the top and dorsal to the right. (b) Quantification of numbers of TUNEL-positive cells with approximately four embryos for each group in a. Error bars represent S.E.M. (n=4). (c) Confocal z-stacks of mitotic cells assessed by pH3 (phosphorylated histone H3) staining in embryos which were WT (i, vi) and injected with zNoxa MO1+2 (ii, vii), zNoxa mRNA (iii, viii), combined zNoxa MO1+2 and rcRNA (iv, ix) or zNoxa mismatch MO1+2 (v, x) at shield and 75% epiboly stages. Embryos stained by pH3 were lateral views with animal pole toward the top and dorsal to the right. (d) Quantification of numbers of pH3-positive cells with five embryos for each group in c. Error bars represent S.E.M. (n=5 embryos each). (e) A typical FACS analysis of PI (propidium iodide)-labeled cells in embryos for each group in c. (f) The FACS statistical data of three independent experiments in e. Error bars represent S.E.M. (n=3). (g) Confocal z-stacks of mitotic cells assessed by pH3 staining in embryos which were injected with zNoxa MO1+2 plus mNoxa mRNA or mNoxa mRNA at shield stage. (h) Quantification of numbers of pH3-positive cells with five embryos for each group in g. Error bars represent S.E.M. (n=5 embryos each). (i) A typical FACS analysis of PI-labeled cells in embryos for each group in g. (j) The FACS statistical data of three independent experiments in i. Error bars represent S.E.M. (n=3) PHENOTYPE:
|
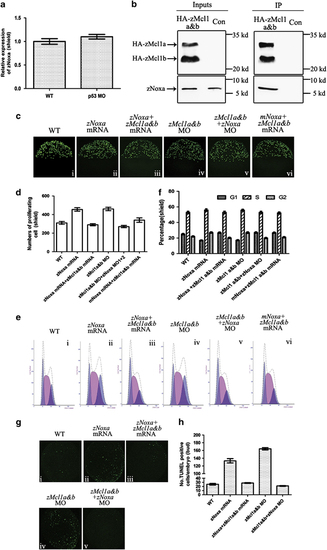
The ability of zNoxa is suppressed by zMcl1a and zMcl1b. (a) Expression of zNoxa in WT and p53 MO-injected embryos was evaluated by real-time PCR and normalized to β-actin mRNA. (b) pcDNA3.1-HA-zMcl1a and pcDNA3.1-HA-zMcl1b were injected into zebrafish embryos to assess an interaction with endogenous zNoxa. At shield stage, zMcl1a-HA and zMcl1b-HA were immunoprecipitated (IP) and then the co-precipitation of zNoxa was assessed by immunobloting. (c) Confocal z-stacks of mitotic cells assessed by pH3 staining in embryos which were WT (i) and injected with zNoxa mRNA (ii), combined zNoxa mRNA and zMcl1a&b mRNA (iii), zMcl1a&b MOs (iv), zNoxa MO1+2 plus zMcl1a&b MOs (v) or mNoxa mRNA together with zMcl1a&b mRNA (vi) at shield stage. Embryos stained by pH3 were lateral views with animal pole toward the top and dorsal to the right. (d) Quantification of numbers of pH3-positive cells with five embryos for each group in (c). Error bars represent S.E.M. (n=5). (e) A typical FACS analysis of PI-labeled cells in embryos for each group in c. (f) The FACS statistical data of three independent experiments in e. Error bars represent S.E.M. (n=3). (g) Confocal z-stacks of apoptotic cells assessed by TUNEL in embryos which were WT (i), injected with zNoxa mRNA (ii), combined zNoxa mRNA and zMcl1a&b mRNA (iii), zMcl1a&b MO (iv), zNoxa MO1+2 together with zMcl1a&b MO (v) at bud stage. Embryos were lateral views with animal pole toward the top and dorsal to the right. (h) Quantification of numbers of TUNEL-positive cells with four embryos for each group in g. Error bars represent S.E.M. (n=4) |
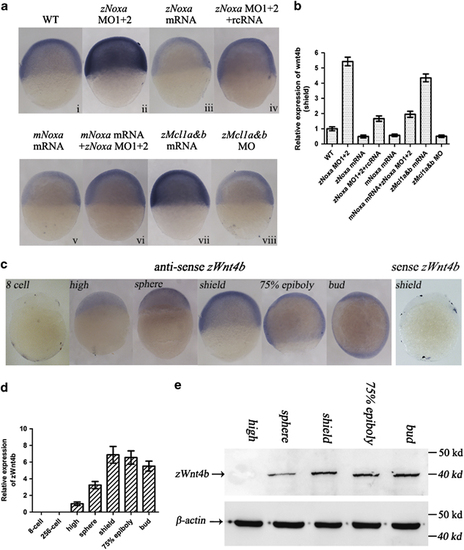
Activities of zWnt4b is regulated by zNoxa. (a) Expression of zWnt4b in embryos, which were WT (i) and injected with zNoxa MO1+2 (ii), zNoxa mRNA (iii), zNoxa MO1+2 plus zNoxa rcRNA (iv), mNoxa mRNA (v), together mNoxa mRNA with zNoxa mRNA (vi), zMcl1a&b mRNA (vii), or zMcl1a&b MO (viii), was detected by in situ hybridization. (b) Expression of zWnt4b in embryos for each group in a. (c) Expression pattern of zWnt4b was detected by in situ hybridization using specific antisense or sense probes. No staining was present in embryos hybridized with sense probe (the shield stage shown). Embryo were lateral views with anterior toward the top. (d) Expression of zWnt4b in embryonic development stages was checked by real-time PCR and normalized to β-actin mRNA. Error bars represent S.E.M. (n=3). (e) Zebrafish embryos were collected at different stages and protein was extracted for immunoblot analysis of zWnt4b and β-actin after discarding the yolk. β-actin served as a loading control |
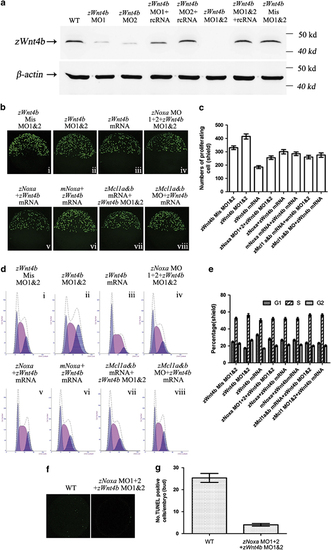
Mitosis regulated by zNoxa is dependent on zWnt4b. (a) At the shield stage, protein was extracted from embryos and 30 µg of each sample was immunoblotted for zWnt4b and β-actin. β-Actin served as an internal control. (b) Confocal z-stacks of mitotic cells assessed by pH3 staining in embryos which were injected with zWnt4b Mis MO1&2 (i), zWnt4b MO1&2 (ii), zWnt4b mRNA (iii), zNoxa MO1+2 plus zWnt4b MO1&2 (iv), zNoxa mRNA together with zWn4b mRNA (v), mNoxa mRNA plus zWnt4b mRNA (vi), combined zMcl1a&b mRNA and zWnt4b MO1&2 (vii), or zMcl1a&b MO coupled with zWnt4b mRNA (viii) at shield stage. Embryos stained by pH3 were lateral views with animal pole toward the top and dorsal to the right. (c) Quantification of numbers of pH3-positive cells with five embryos for each group in (b). Error bars represent S.E.M. (n=5). (d) A typical FACS analysis of PI-labeled cells in embryos for each group in b. (e) The FACS statistical data of three independent experiments in d. Error bars represent S.E.M. (n=3). (f) Confocal z-stacks of apoptotic cells assessed by TUNEL in embryos that were wt and injected with zNoxa MO1+2 plus zWnt4b MO1&2 at bud stage. Embryos were lateral views with animal pole toward the top and dorsal to the right. (g) Quantification of numbers of TUNEL-positive cells with four embryos for each group in e. Error bars represent S.E.M. (n=4) |