
- Title
-
Tnfa signaling through tnfr2 protects skin against oxidative stress-induced inflammation
- Authors
- Candel, S., de Oliveira, S., López-Muñoz, A., García-Moreno, D., Espín-Palazón, R., Tyrkalska, S.D., Cayuela, M.L., Renshaw, S.A., Corbalán-Vélez, R., Vidal-Abarca, I., Tsai, H.J., Meseguer, J., Sepulcre, M.P., Mulero, V.
- Source
- Full text @ PLoS Biol.
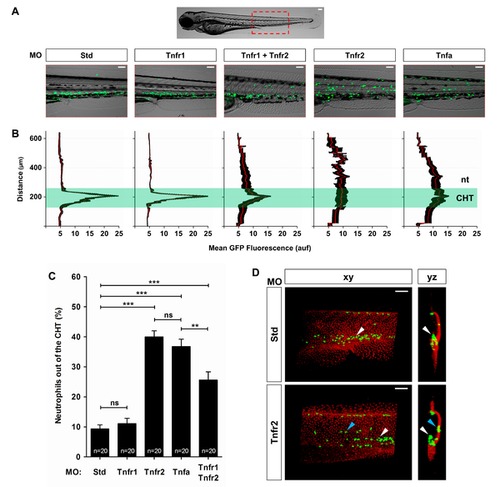
TNFα and Tnfr2 deficiencies result in neutrophil mobilization to the skin. Zebrafish one-cell mpx:eGFP and/or krt18:RFP embryos were injected with standard control (Std), Tnfr1, Tnfr2, Tnfa, or Tnfr1+Tnfr2 MOs. (A) Representative images, bright field and green channels, of the morphants at 3 dpf showing the differences in the neutrophils distribution. (B) Fluorescence intensity was measured for all the groups in the area indicated (A), which includes the CHT, where most neutrophils are located in wild-type larvae at 3 dpf. The images were converted to a fluorescence value matrix where the value obtained for each pixel transversally was the mean ± S.E.M. for all the pixels for each row (15 larvae per treatment from 3 different experiments). The area corresponding to the CHT has been labeled and highlighted. The notochord (nt) location has been indicated to facilitate the larval orientation. auf, arbitrary units of fluorescence. (C) The neutrophil mobilization from the CHT in Tnfa- and Tnfr2-deficient larvae was quantified as the percentage of neutrophils outside the CHT in 20 larvae per group from 3 different experiments. The mean ± S.E.M. for each group is shown. (D) Representative frontal (xy) and lateral (yz) views of tridimensional reconstructions from confocal microscopy images of WIHC of mpx:eGFP larvae stained at 3 dpf with anti-p63 antibodies (basal keratinocyte marker, red) showing the neutrophils′ distribution in the CHT area of control and Tnfr2-deficient larvae. Note that most neutrophils (eGFP, green) are located in the CHT in control larvae (white arrowheads), while many of them infiltrate the skin (blue arrowheads) of Tnfr2-deficient larvae, whereas they are mainly located in the CHT in their wild-type siblings. Scale bars, 100 µm. ns, not significant. *p<0.05, **p<0.01, ***p<0.001. |
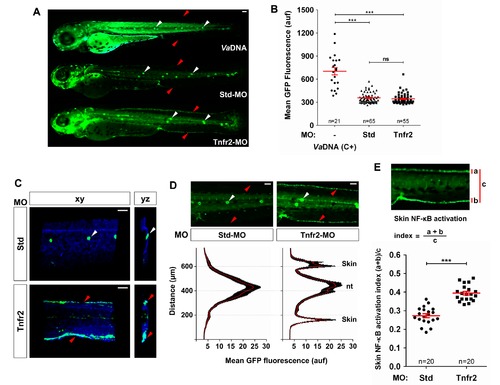
Tnfa and Tnfr2 deficiencies result in skin NF-κB activation. Zebrafish one-cell NF-κB:eGFP (A, B, D, E) or NF-κB:eGFP; krt18:RFP (C) embryos were injected with standard control (Std) or Tnfr2 MOs alone or in the presence of 2.3 ng/egg of V. anguillarum genomic DNA (VaDNA), as a positive control for NF-κB activation. (A) Representative pictures showing the induction of NF-κB activation in the skin (red arrowheads) of Tnfr2-deficient larvae at 72 hpf and the ubiquitous, strong induction in their VaDNA-injected siblings. Note the strong expression of NF-κB in neuromasts of control larvae (white arrowheads). (B) The mean GFP fluorescence was quantified in whole larvae, and no significant differences between Tnfr2-morphants and control larvae were observed. Each dot represents the mean GFP fluorescence per single larva. The mean ± S.E.M. of the whole GFP fluorescence for each group of larvae is also shown. (C) Representative frontal (xy) and lateral (yz) views of tridimensional reconstructions from confocal microscopy images of WIHC of NF-κB:eGFP; krt18:RFP larvae stained at 3 dpf with anti-RFP antibodies (keratinocytes, blue) showing the induction of NF-κB in the skin (eGFP, green) of Tnfr2-deficient larvae. (D, E) Quantification of NF-κB activation in the skin of Tnfr2-deficient larvae at 72 hpf. (D) Fluorescence intensity was measured in the area indicated of wild-type and Tnfr2-deficient larvae, as explained in the legend to Figure 1 (15 larvae per treatment from 3 different experiments). The skin and the neuromasts have been labeled to facilitate the larval orientation. Note the activation of NF-κB in the skin of Tnfr2-deficient larvae. (E) The skin NF-κB activation index was defined as the fluorescence in the skin (a+b) relative to the total fluorescence of the whole larvae (c). Each dot represents the skin NF-κB activation index per single larva. The mean ± S.E.M. of the skin NF-κB activation index for each group of larvae is also shown. Scale bars, 100 μm. ns, not significant; auf, arbitrary units of fluorescence. *p<0.05; **p<0.01; ***p<0.001. |
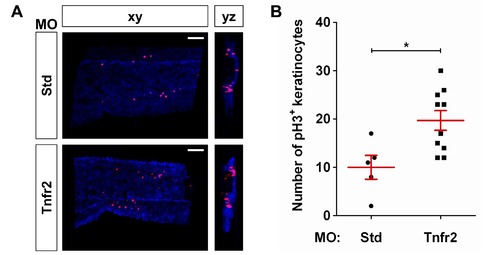
Tnfr2 deficiency results in increased proliferation of skin keratinocytes. Zebrafish one-cell krt18:RFP embryos were injected with standard control (Std) or Tnfr2 MOs. (A) Representative frontal (xy) and lateral (yz) tridimensional reconstructions from confocal microscopy images of WIHC of krt18:RFP larvae stained at 3 dpf with anti-RFP (keratinocytes, blue) and anti-phosphorylated H3 (pH 3, proliferation marker) antibodies. (B) Quantification of the number of pH3/RFP+ (i.e., proliferating keratinocytes) cells in the CHT area. Each dot represents one single larva, and the mean ± S.E.M. for each group of larvae is also shown. Scale bars, 100 μm. *p<0.05. |
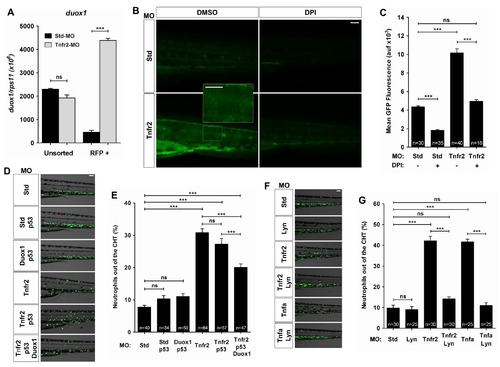
Tnfa and Tnfr2 deficiencies result in the Duox1-derived H2O2 production by keratinocytes. Zebrafish one-cell krt18:RFP (A), wild-type (B, C), or mpx:eGFP (D–G) embryos were injected with standard control (Std), Tnfr2, Tnfa, Duox1/p53, and/or Lyn MOs. (A) The expression of the duox1 gene was measured by RT-qPCR in FACS-sorted keratinocytes from 72 hpf wild-type and Tnfr2-deficient larvae. (B, C) Wild-type and Tnfr2-deficient larvae were dechorionated at 24 hpf and treated by immersion in 100 μM DPI or vehicle alone (DMSO) for 24 h and then labeled with 50 μM acetyl-pentafluorobenzene sulphonyl fluorescein. Representative images of green channels of Std and Tnfr2 morphants are shown. Note that single keratinocytes are labeled with the H2O2 probe in Tnfr2-deficient larvae (inset). (D–G) Rescues with Duox1 (D, E) and Lyn (F, G) MOs at 72 hpf. The differences in the neutrophil distribution (D, F) and quantification of neutrophil mobilization from the CHT to the skin in the indicated number of larvae per group from three different experiments (E, G) are shown. The mean ± S.E.M. for each group is shown. Scale bars, 100 μm. ns, not significant. ***p<0.001. |
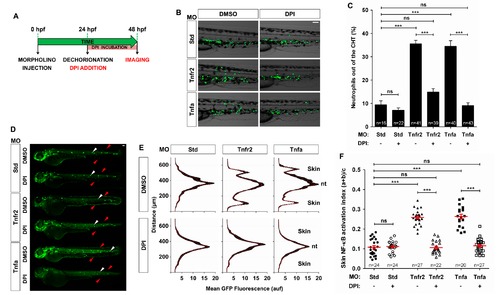
Pharmacological inhibition of Duox1 prevents skin inflammation in Tnfa- and Tnfr2-deficient zebrafish. Zebrafish one-cell mpx:eGFP (B, C) and NF-κB:eGFP (D–F) embryos were injected with standard control (Std), Tnfr2, or Tnfa MOs. (A) Scheme showing the experimental procedure: embryos were dechorionated at 24 hpf and treated by immersion in 100 µM DPI or vehicle alone (DMSO) for 24 h. (B, C) Representative images of bright field and green channels of the morphants at 48 hpf showing the differences in the neutrophils distribution (B) and quantification of neutrophil mobilization from the CHT to the skin in the indicated number of larvae per group from three different experiments (C). (D–F) Quantification of NF-κB activation in the skin of Tnfr2- and Tnfa-deficient larvae at 72 hpf. (E) Fluorescence intensity was measured for all the groups in the area indicated, as explained in the legend to Figure 1 (15 larvae per treatment from 3 different experiments). The skin and the notochord (nt) have been labeled to facilitate the larval orientation. Note the activation of NF-κB in the skin (red arrowheads) of Tnfr2-deficient larvae. Note the strong expression of NF-κB in neuromasts (white arrowheads). (F) Skin NF-κB activation index was defined as the fluorescence in the skin (a+b) relative to the total fluorescence of the whole larvae (c). Each dot represents the skin NF-κB activation index per single larva. The mean ± S.E.M. of the skin NF-κB activation index for each group of larvae is also shown. Scale bars, 100 μm. ns, not significant. ***p<0.001. |
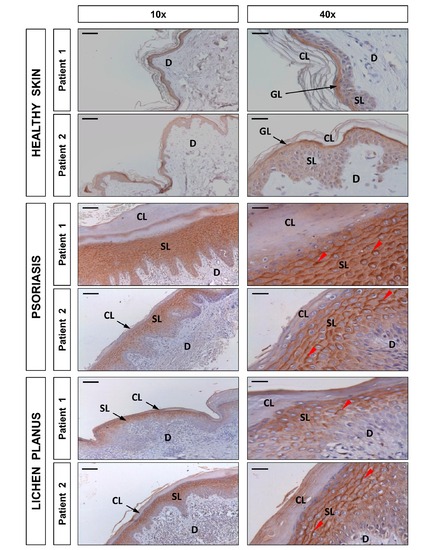
DUOX1 is induced in human psoriasis and lichen planus lesions. Representative images of sections from two healthy, two psoriatic, and two lichen planus skin biopsies that have been immunostained with an anti-DUOX1 goat polyclonal antibody and then slightly counterstained with hematoxilin. Note that DUOX1 is weakly expressed in healthy epidermis, mainly in the granular layer (GL), whereas it is strongly expressed (red arrowheads) in the spinous layer (SL) of both psoriasis and lichen planus lesions. CL, cornified layer; D, dermis. Scale bars, 100 μm (left panel) and 30 μm (right panel). |
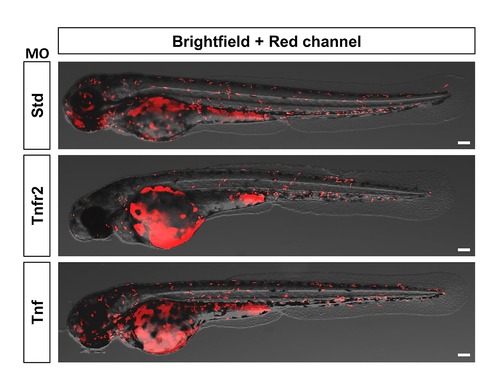
Macrophage distribution is not altered in Tnfa- or Tnfr2-deficient larvae. Zebrafish one-cell mpeg1:eGFP embryos were injected with standard control (Std), Tnfr2, and Tnfa MOs. Representative images showing macrophage distribution in 72 hpf larvae. Scale bars, 100 μm. |
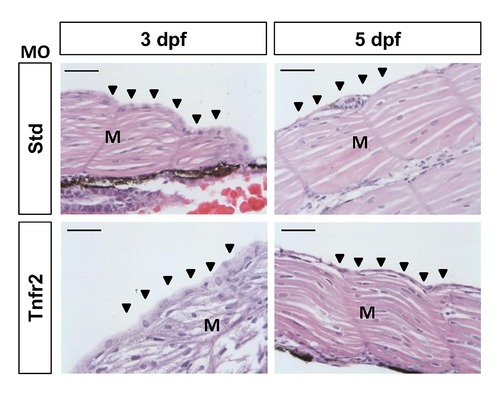
The skin of Tnfr2-deficient larvae does not show histopathological alterations. Zebrafish one-cell embryos were injected with standard control (Std) or Tnfr2 MOs. At 3 (A) and 5 (B) dpf, the larvae were fixed, embedded in Paraplast Plus, sectioned at 5 µm, and stained with H&E. M, muscle. Arrowheads, skin. Scale bars, 50 μm. |
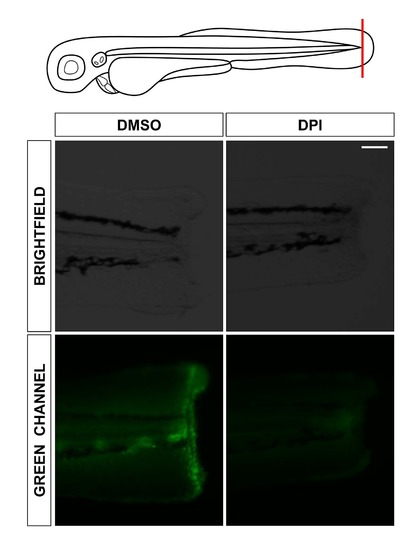
Pharmacological inhibition of Duox1 inhibits H2O2 production after wounding. Zebrafish one-cell wild-type embryos were treated at 72 hpf by immersion in 100 μM DPI or vehicle alone (DMSO) in the presence of 50 μM acetyl-pentafluorobenzene sulphonyl fluorescein, and tailfins were then transected. Representative images of the formation of the H2O2 gradient at 1 h postwounding. Note that DPI treatment completely inhibits H2O2 formation at the wound. Scale bars, 100 μm. |
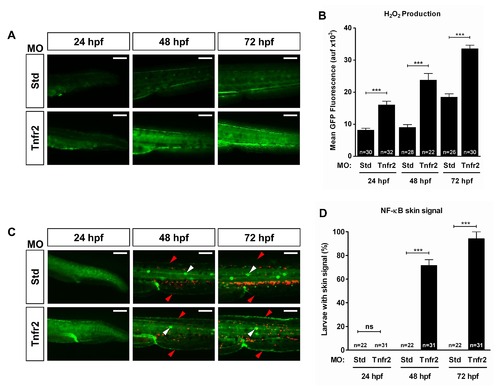
H2O2 production by Tnfr2-deficient keratinocytes preceded the activation of NF-κB. Zebrafish one-cell wild-type (A, B) or lyz:dsRED; NF-κB:eGFP (C, D) embryos were injected with standard control (Std) or Tnfr2 MOs. (A, B) Larvae were dechorionated at 24 hpf and then labeled with 50 μM acetyl-pentafluorobenzene sulphonyl fluorescein at 24, 48, and 72 hpf. Representative images of green channels of Std and Tnfr2 morphants (A) and quantification of green fluorescence in the indicated number of larvae (B) are shown. Note that increased H2O2 production by skin keratinocytes is already observed at 24 hpf. (C) Representative pictures showing NF-κB activation levels in control and Tnfr2-deficient larvae at 24, 48, and 72 hpf. Note that NF-κB is induced in the skin (red arrowheads) of Tnfr2-deficient larvae at 48 h and that neutrophil dispersion is observed at 72 hpf and, to some extent, at 48 hpf. The neuromasts are indicated with white arrowheads. (D) Quantification of the percentage of larvae showing activation of the NF-κB in the skin. The results are shown as the mean ± S.E.M. The number of larvae analyzed is also indicated. Scale bars, 100 μm. ns, not significant; auf, arbitrary units of fluorescence. *p<0.05; **p<0.01; ***p<0.001. |
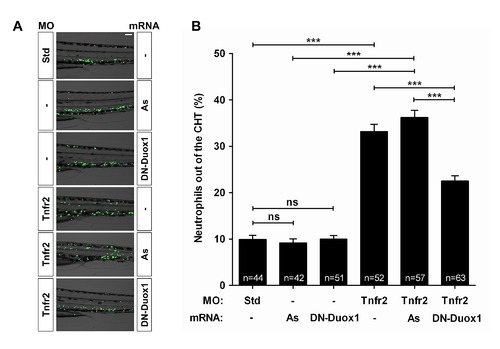
Genetic inactivation of Duox1 using a DN form partially prevents neutrophil infiltration into the skin of Tnfa- and Tnfr2-deficient zebrafish. Zebrafish one-cell mpx:eGFP embryos were injected with standard control (Std), Tnfr2, or Tnfa MOs alone or combination with antisense (As) or DN-Duox1 mRNAs. Representative images of bright field and green channels of morphants at 72 hpf showing the differences in the neutrophils distribution (A) and quantification of neutrophil mobilization from the CHT to the skin in the indicated number of larvae per group from three different experiments (B). The mean ± S.E.M. for each group is shown. Scale bars, 100 μm. ns, not significant. ***p<0.001. |