
- Title
-
Snail modulates the assembly of fibronectin via alpha5 integrin for myocardial migration in zebrafish embryos
- Authors
- Qiao, L., Gao, H., Zhang, T., Jing, L., Xiao, C., Xiao, Y., Luo, N., Zhu, H., Meng, W., Xu, H., Mo, X.
- Source
- Full text @ Sci. Rep.
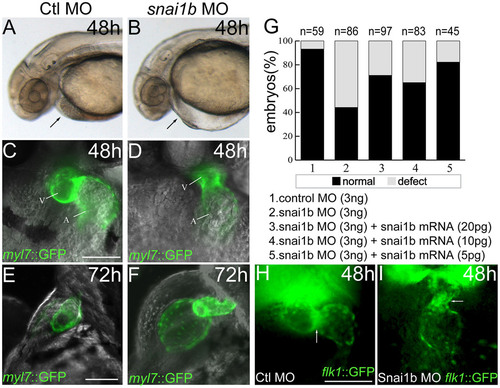
(A, B): Phenotypes of snai1b knockdown at 48hpf, lateral view. Black arrows: heart valve. (C–F): Changes in heart shape in myl7::GFP embryos injected with control (Ctl) and snai1b MO at 48hpf and 72hpf. A, atrium; V, ventricle. (G): Quantification of phenotypes produced by snai1b morphants at 48hpf, with or without snai1b mRNA at different concentrations. (H, I): Heart endocardium in flk::GFP embryos injected with Ctl and snai1b MO at 72hpf. White arrows: heart. Scale bars: 100µm. EXPRESSION / LABELING:
PHENOTYPE:
|
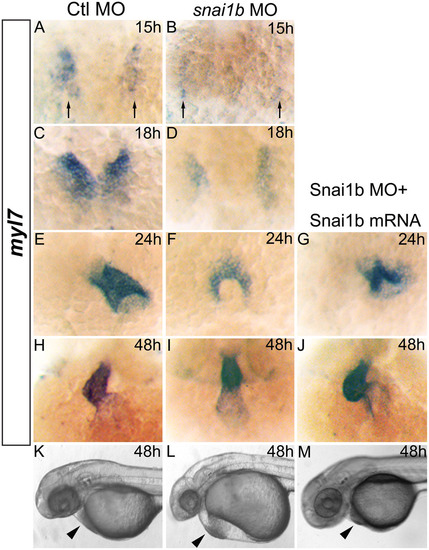
(A–J): myl7 expression marking myocardial precursor cells in zebrafish embryos. (A, C, E, H): embryos injected with Ctl MO develop normally at 15, 18, 24, and 48hpf. (B, D, F, I): embryos injected with snai1b MO display cardiac fusion delays (B, D, F) and band-like heart shape at 48hpf (I). Myl7 expression (black arrows) is reduced at 15 and 18hpf (B, D). (G, J): embryos injected with both snai1b MO and mRNA display partial rescue of heart defects. (K–M): rescue of heart defects (arrowhead) in embryo injected with snai1b MO and mRNA at 48hpf. EXPRESSION / LABELING:
PHENOTYPE:
|
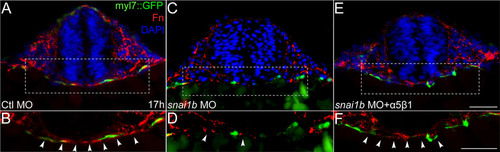
Transverse sections of myl7::GFP (green) transgenic embryos immunostained for Fn (red). DAPI (blue) staining indicates nuclei. (A, B): Fn fibrils around myocardial precursors and across the midline in control embryos. (C, D): Fn levels decrease in snai1b MO injected embryos. (E, F): Fn levels are restored in embryos injected with α5β1 integrin protein. (B, D, and F): Magnified view of dashed rectangle of A, C, and E, respectively. Scale bars: 50µm. EXPRESSION / LABELING:
|
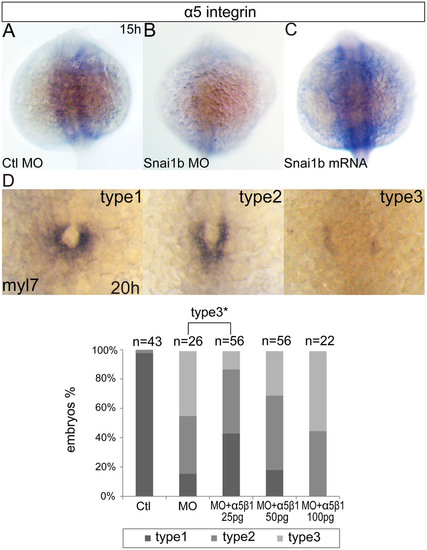
In situ hybridization for indicated genes. (A–C): Expression pattern of α5 integrin in different embryos at 15hpf, dorsal view. (D): different types of phenotypes displayed in injected embryos at 20hpf. Graph shows phenotypic ratios of injected embryos at the same stage. Percentage of embryos of type 3 between embryos with snai1b MO and those with both snai1b MO and 25pg α5β1 integrin protein was statistically significant (P = 0.023, t-test). Ctl means Ctl MO, MO means snai1b MO. EXPRESSION / LABELING:
|
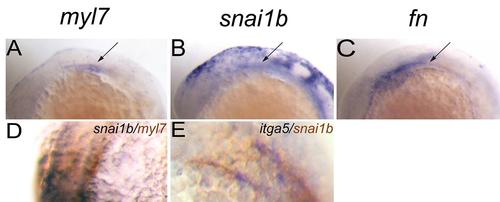
Snai1b expression is related to myocardial precursors and Fn at 14–15 hpf. (A–C): In situ hybridization for indicated genes. (A): myl7 expression pattern. (B): snai1b expression pattern. (C): Fn expression pattern. (A–C) lateral view, (D): snai1b expression in cardiac precursors overlaps with myl7 (Brown). (E): itga5 was co-expressed with snai1b (Brown). EXPRESSION / LABELING:
|
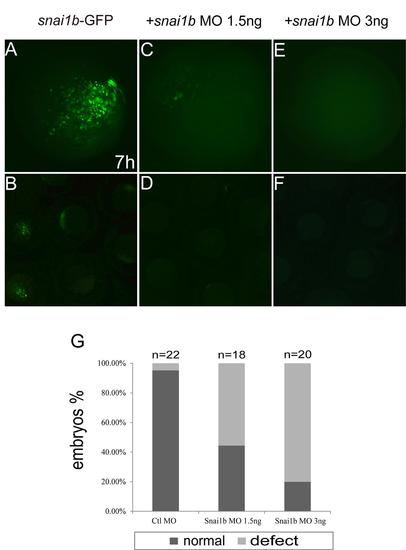
Efficiency of snai1b MO in injected embryos. (A–F): different concentrations of snai1b MO inhibited the expression of Snai1b-GFP fusion protein in zebrafish at 7 hpf. (A, C, E): Magnified view of rectangle in B, D, and F, respectively. (G): quantification of phenotypes produced by different concentrations of snai1b MO at 48 hpf. |
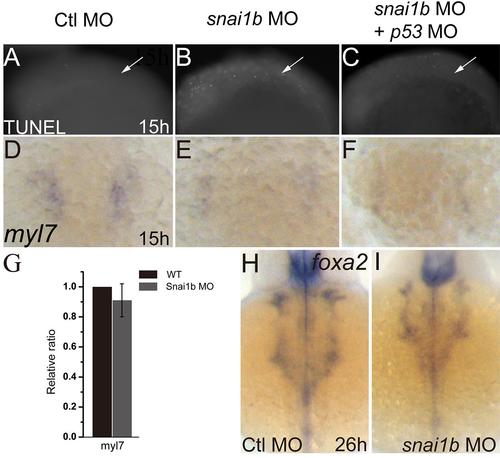
Heart defects induced by snai1b knockdown are not due to apoptosis or endodermal defects. (A–C): TUNEL assay shows increased apoptosis in the snai1b MO injected embryos (B) compared to controls (A). Co-injection of p53 MO inhibits apoptosis (C) at 15 hpf. White arrows: cardiac precursor regions. (D–F): myl7 expression was decreased in snai1b MO injected embryos (E) compared to controls (D), and p53 MO did not rescue myl7 expression at 15 hpf. (G): q-PCR showed the myl7 expression do not change at 15 hpf (H, I): endoderm formation was not influenced, as judged by the expression of the endoderm marker foxa2 at 26 hpf. |
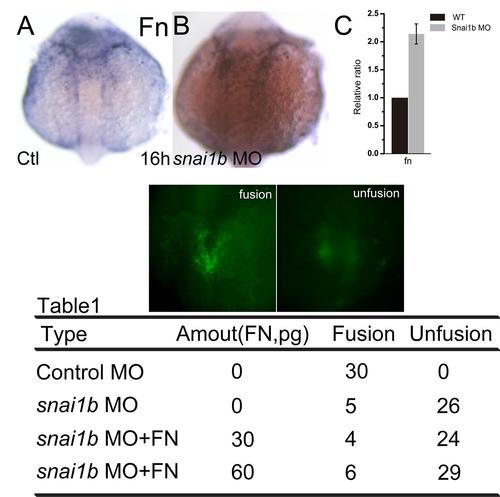
Snai1b modulates Fn assembly, but does not affect the expression of fn. (A, B): fn expression was not changed at 16 hpf. (C): q-PCR showed the increased fn expression at 18 hpf. Table 1: phenotypes caused by exogenous Fn co-injected at 18 hpf. |
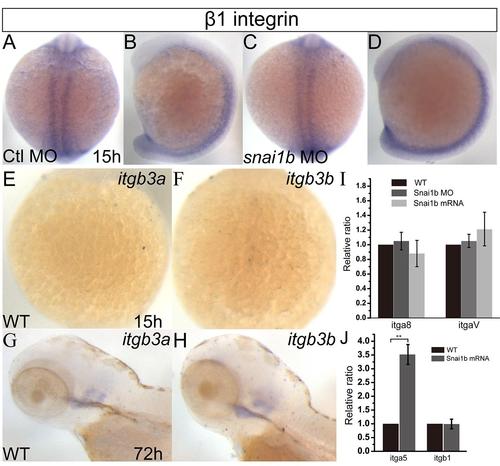
Some integrins are not regulated by snai1b. (A-H): In situ hybridization for indicated genes. (A-D): β1 integrin expression was not changed by snai1b knockdown at 15 hpf. (A, C): dorsal view, (B, D): lateral view. (E-H): β3a and β3b integrin expression was not detected at 15 hpf (E, F), but at 72 hpf (G, H). (I): qRT-PCR showed that α8 and αV integrin transcription was not regulated by snai1b at 15 hpf. (J): qRT-PCR showed that α5 integrin transcription was up-regulated by snai1b overexpression, but not β1 integrin transcription at 15 hpf. The increased of α5 integrin transcription was statistically significant (P=0.007, t-test). |
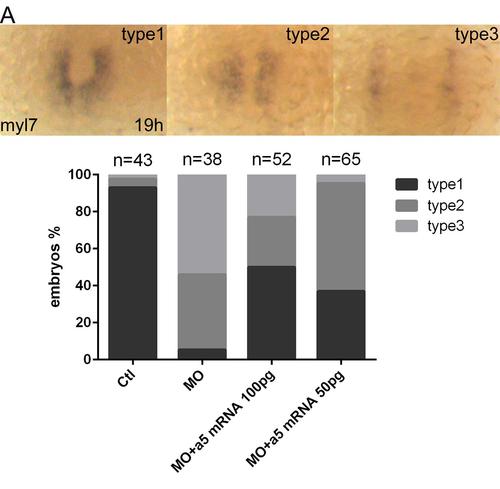
α5 integrin mRNA rescues cardiac defects induced by Snai1b knockdown. (A): different types of phenotypes displayed in injected embryos at 19 hpf. Graph shows phenotypic ratios of injected embryos at the same stage. Ctl means Ctl MO, MO means snai1b MO. |
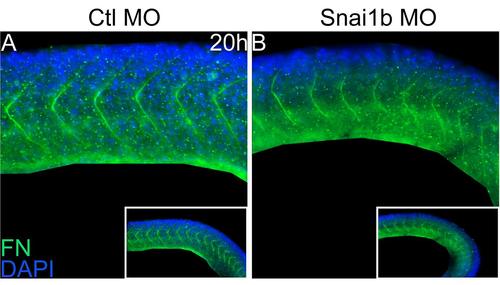
Loss of Snai1b resulted in abnormal Fibronectin matrix assembly. Lateral view, (A): Fn assembly was normal in the control embryo, (B): Fn assembly was disrupted in the morphant, especially in the posterior somites. EXPRESSION / LABELING:
PHENOTYPE:
|