
- Title
-
Mesodermal Fgf10b cooperates with other Fgfs during induction of otic and epibranchial placodes in zebrafish
- Authors
- Maulding, K., Padanad, M.S., Dong, J., Riley, B.B.
- Source
- Full text @ Dev. Dyn.
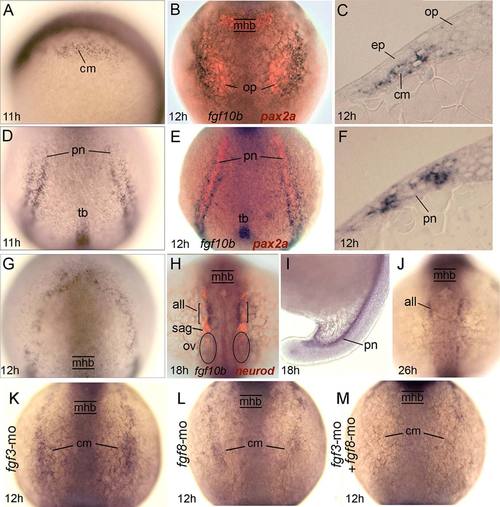
Expression and regulation of fgf10b. A-G: Early expression of fgf10b marks mesoderm near the otic/epibranchial domain (A-C), flaking the pronephros (D-F), and surrounding the anterior neural plate (G). Specimens in (B) and (E) also show pax2a expression (red) in the otic placode and pronephros, while (C) and (F) show fgf10b expression in cross-sections. H-J: Late expression in the anterior lateral line and pronephros. The specimen in (H) also shows neurod expression (red) to reveal neurogenesis in various placodal derivatives. K-M: Expression of fgf10b in cranial mesoderm appears normal in fgf3 morphants (K) but is reduced in fgf8 morphants (L) and nearly abolished in fgf3-fgf8 double morphants (M). all, anterior lateral line; cm, cranial mesoderm; ep, epibranchial placode; mhb, midbrain-hindbrain border; op, otic placode; ov, otic vesicle; pn, pronephros; sag, statoacoustic ganglion; tb, tailbud. Whole-mount specimens are shown with dorsal views (anterior to the top) except for (A,I), which are lateral views with dorsal to the right. Cross-sections are shown with dorsal to the top. EXPRESSION / LABELING:
|
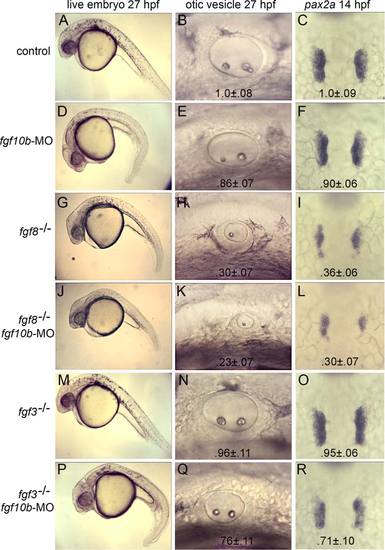
fgf10b cooperates with fgf3 and fgf8 in otic induction. A-R: Live specimens at 27 hpf viewed at low magnification to show general morphology and high magnification to show otic vesicles; and dorsal views of in situ hybridizations to visualize pax2a in the otic placodes at 14 hpf. Genetic manipulations are indicated down the left side of the figure. Mean surface area (± standard deviation, n ≥ 8) of otic placodes and vesicles, normalized to wild-type control embryos, are indicated for each genotype/knockdown. EXPRESSION / LABELING:
PHENOTYPE:
|
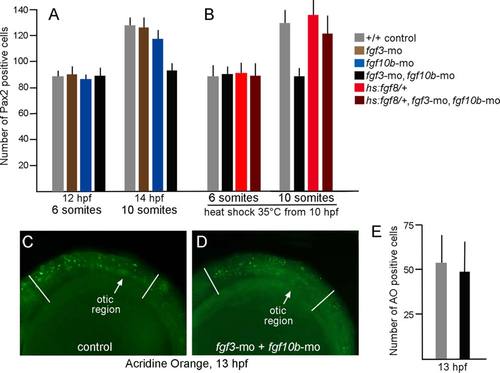
Otic deficiencies in fgf3-fgf10b double morphants and rescue by timed misexpression of fgf8. A,B: The number of Pax2-expressing cells in the otic vesicle at 12 hpf and 14 hpf in embryos with various genotypes and gene knockdown, as indicated in the color key. Embryos in (B) were incubated at 35°C from 10 hpf until fixation at the 8- or 10-somite stage. Note that incubation at 35°C accelerates development such that these stages occur slightly earlier than normal. C,D: Comparison of the number of apoptotic cells stained with acridine orange (AO) in the head between the eye and first somite (marked by white lines), as seen from a lateral view in control embryos (C) or fgf3-fgf10b double morphants (D). E: Data show means and standard deviations of eight specimens each. |
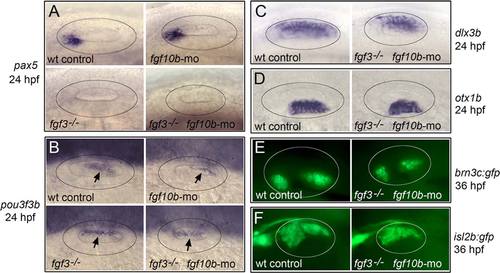
Effects of fgf10b knockdown on otic vesicle patterning. A-F: Lateral view (anterior to the left) of the otic vesicle (circled) at 24 hpf (A-D) and 36 hpf (E,F) labeled for the indicated genes. Arrows in (B) indicate the otic domain of pou3f3b. |
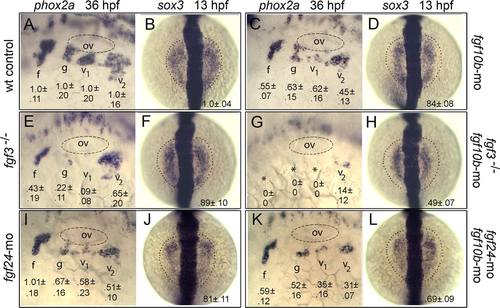
fgf10b cooperates with fgf3 and fgf24 in epibranchial induction. A-L: Lateral views (anterior to the left) of phox2a expression in epibranchial ganglia at 36 hpf; and dorsal views (anterior to the top) of sox3 expression at 13 hpf (normal boundaries of the control are outlined). Genetic manipulations are indicated along the sides. Positions of the otic vesicle (ov) and facial (f), glossopharyngeal (g), and vagal ganglia (v1 and v2) are indicated. Mean surface areas (± standard deviation, n ≥ 8), normalized to wild-type control embryos, are indicated for each structure. EXPRESSION / LABELING:
|
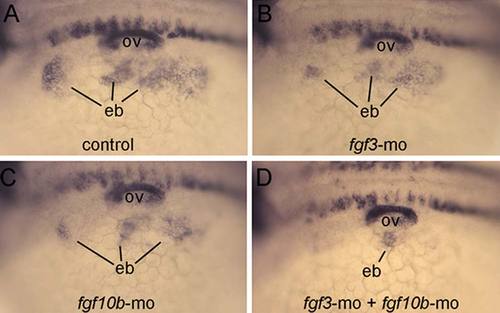
Loss of epibranchial expression of pax2a in fgf3-fgf10b deficient embryos. A-D: Lateral views (anterior to the left) showing expression of pax2a in the otic vesicle (ov) and nascent epibranchial placode (eb) at 24 hpf. Compared with a control embryo (A), knockdown of fgf3 (B), or fgf10b (C) causes moderate deficiencies in epibranchial placodes, whereas knockdown of both fgf3 and fgf10b nearly abolishes the epibranchial domain (D). EXPRESSION / LABELING:
|

Rescue of epibranchial development in fgf3-fgf10b deficient embryos by timed misexpression of fgf8. A-L: Dorsal views (anterior to the top) of pax2a expression at the 10-somite stage and sox3 expression at the 8-somite stage (normal boundaries of the control are outlined), and lateral views (anterior to the left) of phox2a expression at 36 hpf in embryos incubated at 35°C from 10 hpf until the eight-somite stage (for sox3) or the 10-somite stage (for pax2a and phox2a). Genetic manipulations are indicated along the left side. Positions of the otic vesicle (ov) and facial (f), glossopharyngeal (g), and vagal ganglia (v1 and v2) are indicated. Mean surface areas (± standard deviation, n ≥ 8), normalized to wild-type control embryos, are indicated for each structure EXPRESSION / LABELING:
|

fgf10b is not required for development of other cranial placodes. A-D: Dorsal views (anterior to the top) showing expression of neurod in nascent trigeminal (trig) and anterior lateral line (all) placodes at 14 hpf in a control embryo (A), fgf10b morphant (B), fgf3 morphant (C), and fgf3-fgf10b double morphant. EXPRESSION / LABELING:
|
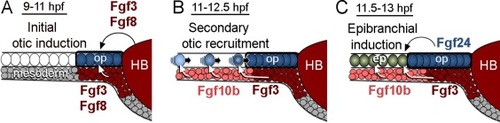
A network of Fgf ligands regulates otic-epibranchial induction. A: Initial otic induction is mediated by Fgf3 and Fgf8 from the hindbrain (HB) and sub-otic mesoderm. B: During secondary otic recruitment, cells converging from more lateral regions initially encounter mesodermal Fgf10b followed by Fgf3. Newly recruited cells continue to join the otic placode through 12.5 hpf (Bhat and Riley, 2011). C: In a final phase, epibranchial fates are induced by a combination of mesodermal Fgf10b and Fgf3 and otic Fgf24. Cells in the facial placode are induced first, followed by cells in more posterior epibranchial tissue (Nechiporuk et al., 2007). |