
- Title
-
Prostaglandin E2 regulates liver versus pancreas cell-fate decisions and endodermal outgrowth
- Authors
- Nissim, S., Sherwood, R.I., Wucherpfennig, J., Saunders, D., Harris, J.M., Esain, V., Carroll, K.J., Frechette, G.M., Kim, A.J., Hwang, K.L., Cutting, C.C., Elledge, S., North, T.E., and Goessling, W.
- Source
- Full text @ Dev. Cell
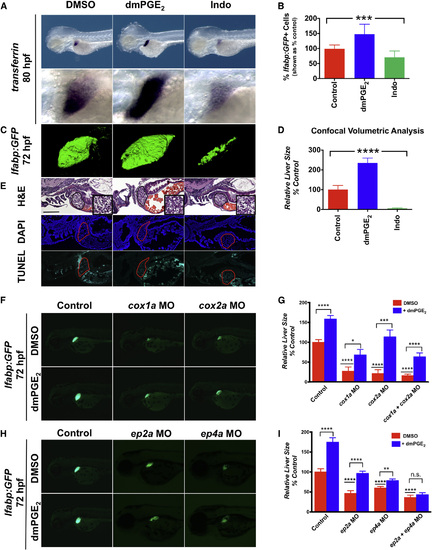
PGE2 Affects Embryonic Liver Outgrowth (A) In situ hybridization for transferrin, a liver-specific marker, reveals that embryonic liver size is regulated by PGE2. Exposure to dmPGE2 from 48 to 80 hpf dramatically increases embryonic liver size (51.4% embryos with an enlarged liver; n = 18/35), whereas exposure to Indo decreases embryonic liver size (76.5% embryos with a smaller liver; n = 26/34). Left lateral view; row below is magnified view. (B) FACS quantification of GFP+ liver cells in lfabp:GFP embryos at 72 hpf following exposure to dmPGE2 or Indo. dmPGE2 increases the relative number of liver cells, whereas Indo decreases the relative number of liver cells. (Data are represented as mean ± SEM; ***significant across treatment groups, ANOVA, p = 0.0009.) (C) Confocal microscopy visualization of the liver in lfabp:GFP embryos at 72 hpf following exposure to dmPGE2 or Indo. Exposure to dmPGE2 from 48 to 72 hpf enlarges the developing liver, whereas exposure to Indo severely abrogates liver development. Left lateral view. (Data are represented as mean ± SEM; n = 5 per treatment.) EXPRESSION / LABELING:
PHENOTYPE:
|
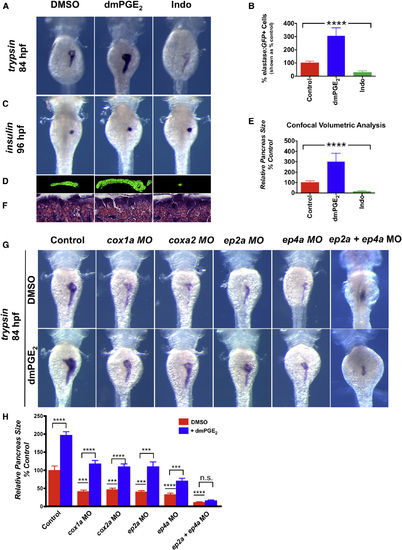
PGE2 Affects Embryonic Pancreas Outgrowth (A) In situ hybridization for trypsin, an exocrine pancreas-specific marker, following exposure to dmPGE2 or Indo reveals that embryonic pancreas size is regulated by PGE2. dmPGE2 increases exocrine pancreas size (57.6% embryos with an enlarged pancreas; n = 38/66), whereas Indo diminishes exocrine pancreas size (70.6% embryos with a smaller pancreas; n = 36/51). Dorsal view. (B) FACS quantification of GFP+ exocrine pancreas cells in elastase:GFP embryos at 96 hpf following exposure to dmPGE2 or Indo. dmPGE2 increases and Indo decreases the relative number of exocrine pancreas cells. (Data are represented as mean ± SEM; ****significant across treatment groups, ANOVA, p < 0.0001.) EXPRESSION / LABELING:
PHENOTYPE:
|
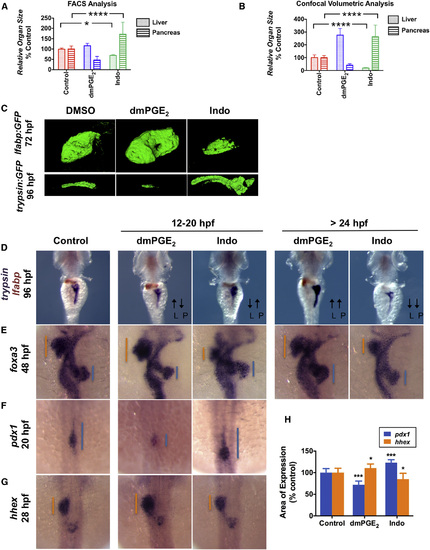
PGE2 Influences Liver versus Pancreas Specification (A) FACS quantification of liver and pancreas GFP+ cells in lfabp:GFP or elastase:GFP fish, respectively, at 96 hpf following exposure to dmPGE2 or Indo from 12 to 20 hpf. (Data are represented as mean ± SEM; significant across treatment groups, ANOVA, p < 0.0001, p < 0.05.) (B) Analysis of organ [volume] × [fluorescence intensity] of the liver or pancreas in lfabp:GFP fish at 72 hpf or trypsin:GFP fish at 96 hpf, respectively, visualized by confocal microscopy following treatment with dmPGE2 or Indo from 12 to 20 hpf. (Data are represented as mean ± SEM; significant across treatment groups, ANOVA, p < 0.0001; n = 5 per condition.) (C) Confocal microscopy of the liver at 72 hpf in lfabp:GFP fish or pancreas at 96 hpf in trypsin:GFP fish following exposure to dmPGE2 or Indo from 12 to 20 hpf. Volume and fluorescence intensity are quantified in (B). (D) Double in situ hybridization for trypsin (purple) + lfabp (brown) at 96 hpf reveals reciprocal effects on organ size following 12–20 hpf exposure to dmPGE2 or Indo. Dorsal view. L, liver; P, pancreas. (E) In situ hybridization for foxa3 at 48 hpf reveals reciprocal effects on the liver and pancreas buds emerging from the gut endoderm. The extent of the liver bud is indicated in orange and of the pancreas bud in blue. Dorsal view. (F and G) Early exposure to dmPGE2 or Indo results in a smaller (89.1% of embryos; n = 41/46) or larger (95.1% of embryos; n = 39/41) domain, respectively, of pancreas progenitor cells visualized by pdx1 at 20 hpf, and a larger (68.6% of embryos; n = 35/51) or smaller (72.7% of embryos; n = 32/44) domain, respectively, of liver progenitor cells marked by hhex at 28 hpf. Dorsal view. (H) Quantification of the area of pancreas progenitors or liver progenitors following exposure to dmPGE2 or Indo during somitogenesis, shown as % control. (Data are represented as mean ± SEM; significant across treatment groups, ANOVA, p < 0.001, p = 0.013; n = 5 per treatment group.) See also Fig. S3. EXPRESSION / LABELING:
PHENOTYPE:
|
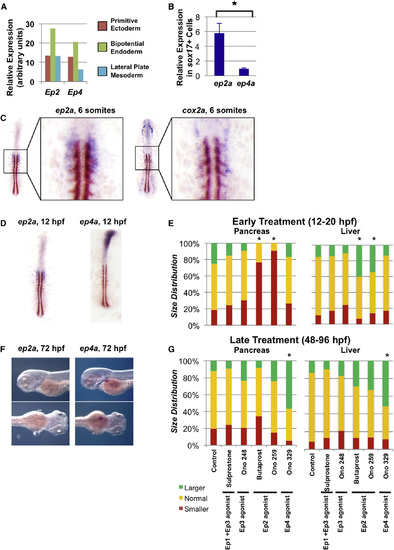
Prostaglandin Pathway Genes Are Patterned to Regulate Endoderm Specification (A) Microarray analysis reveals enrichment of Ep2 and Ep4 in bipotential endoderm progenitors compared to primitive ectoderm or lateral plate mesoderm derived from mouse embryonic stem cells, shown in arbitrary units. (B) Quantitative PCR analysis of sox17+ endodermal cells sorted from sox17:GFP zebrafish embryos reveals enrichment of ep2a compared to ep4a. (Data represented as mean ± SEM; t test, p < 0.05; n = 3.) (C) Double in situ hybridization for ep2a (purple) or cox2a (purple) and myod (brown) in zebrafish embryos at the six-somite stage. (D) Double in situ hybridization for ep2a (purple) or ep4a (purple) and myod (brown) in zebrafish embryos at the six-somite stage. (E) Size distribution of pancreas or liver progenitor domain following exposure to pharmacologic agonists or antagonists of various PGE2 receptors from 12 to 20 hpf. Impact on pancreas progenitors was assessed at 20 hpf by in situ hybridization to pdx1, and impact on liver progenitors was assessed at 28 hpf by in situ hybridization to hhex. The following pharmacologic agents were used: sulprostone (Ep1 + Ep3 agonist), Ono 248 (Ep3 agonist), butaprost (Ep2 agonist), Ono 259 (Ep2 agonist), and Ono 329 (Ep4 agonist). (Significant versus control by χ2 test, p < 0.05; n > 30 for each condition.) (F) Expression of ep2a and ep4a at 72 hpf visualized by in situ hybridization. ep4a but not ep2a expression at 72 hpf corresponds to the emerging liver bud. (G) Size distribution of pancreas or liver organs following exposure to pharmacologic agonists or antagonists of various PGE2 receptors from 48 to 96 hpf. Impact on pancreas outgrowth was assessed at 96 hpf by in situ hybridization to trypsin, whereas impact on liver outgrowth was assessed at 96 hpf by in situ hybridization to lfabp. (Significant versus control by χ2 test, p < 0.05; n > 30 for each condition.) See also Fig. S6. EXPRESSION / LABELING:
PHENOTYPE:
|
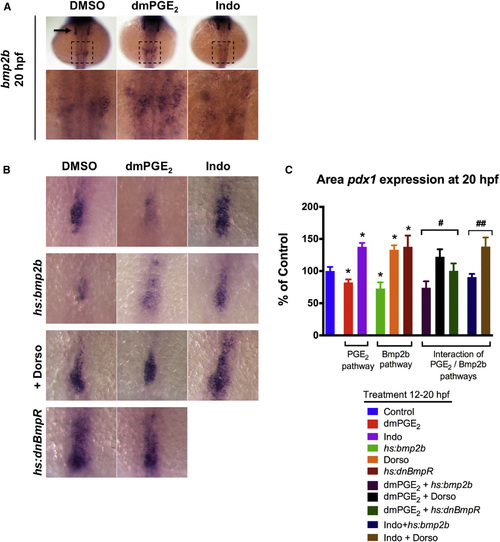
PGE2 Interacts with the bmp2b Pathway to Regulate Liver versus Pancreas Specification (A) Modulation of PGE2 levels from 12 to 20 hpf impacts expression of bmp2b in the lateral plate mesoderm as shown by in situ hybridization at 20 hpf. dmPGE2 increases bmp2b expression (n = 15/19 embryos), whereas Indo decreases bmp2b expression (n = 14/21 embryos). Lower: magnified view of the area in the dashed square. bmp2b is also expressed in the otic vesicles (arrow). (B and C) Size of pancreas-specified population marked by pdx1 is impacted by modulation of the PGE2 or bmp2b pathways. Representative views are shown in (B), and quantification is shown in (C). dmPGE2 or heat-shock activation of bmp2b diminishes whereas Indo, dorsomorphin (Dorso), or heat-shock activation of dnBmpR promotes the pancreas progenitor population. The impact of dmPGE2 is blunted by Dorso or dnBmpR, and the impact of Indo is blunted by heat-shock activation of bmp2b. (Data are represented as mean ± SEM; n e 10 per condition; t test comparisons: p < 0.05 comparing treatment versus control; #no significant difference comparing with versus without dmPGE2; ##no significant difference comparing with versus without Indo.) EXPRESSION / LABELING:
PHENOTYPE:
|
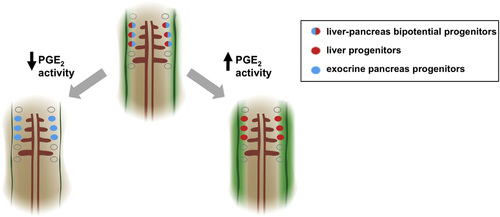
Model for the Role of PGE2 Activity in Liver versus Pancreas Endoderm Specification A model for PGE2 regulation of endodermal specification into liver or pancreas progenitors. Bipotential endodermal cells capable of both a liver and an exocrine pancreas fate (red/blue cells) have been found between somites 1 and 3. Levels of PGE2 (green gradient) may form a gradient with highest activity closest to the two bilateral stripes of cox2a (solid green bands), the rate-limiting enzyme in PGE2 synthesis. Cells closest to the highest levels of PGE2 are more likely to acquire a liver fate (red cells), whereas cells farther from the source of PGE2 acquire an exocrine pancreas fate (blue cells). Augmenting levels of PGE2 promotes a liver fate at the cost of a pancreas fate, whereas decreasing levels of PGE2 promotes a pancreas fate at the cost of a liver fate. |
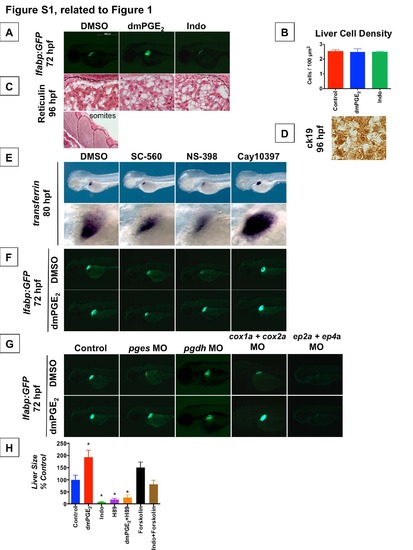
PGE2 affects Liver Development (Related to Figure 1) (A) Analysis of liver size by GFP fluorescence in lfabp:GFP embryos at 72 hpf demonstrates that exposure to dmPGE2 from 48-72 hpf enlarges the liver whereas exposure to Indomethacin severely abrogates liver development (n > 30 each condition). Left lateral view. (B) Quantification of cell density (# nuclei / area) by nuclear counts visualized by DAPI staining. Liver cell density does not change significantly after pharmacologic modulation of prostaglandin activity. (Data are represented as mean ± SEM). (C) Reticulin staining to visualize liver histology at 96 hpf following treatment with dmPGE2 or Indo. Staining was performed and reviewed by a pathologist. As confirmation of the stain, a representative view of developing somites is shown, demonstrating specific staining of reticular fibers. No discernible differences in reticulin staining are observed in the developing liver following modulation of prostaglandin activity. (D) Representative view of ck19 immunohistochemistry of the developing liver at 96 hpf. Low levels of ck19 are broadly expressed in all treatment conditions. ck19 marks hepatobiliary ductal epithelium in the adult liver, but this ductal epithelium has yet to mature in the embryonic liver at 96 hpf. (E) Pharmacologic blockade of PGE2 synthetic enzymes results in a smaller developing liver, as visualized by in situ hybridization for the liver marker transferrin. A smaller embryonic liver results from blockade of cox1a with SC-560 (54.8% embryos with smaller liver, n = 17 / 31) or cox2a with NS-398 (48.5% embryos with smaller liver, n = 16 / 33). In contrast, pharmacologic blockade of PGE2 degrading enzyme prostaglandin dehydrogenase (pdgh) with Cay10397 results in a larger embryonic liver (43.8% embryos with larger liver, n = 14 / 32). Left lateral view, row below is magnified view. (F) Effects of pharmacologic blockade of PGE2 synthetic or degrading enzymes on liver development seen by in situ hybridization for transferrin were corroborated by GFP fluorescence in lfabp:GFP embryos. A smaller embryonic liver results from blockade of cox1a with SC-560 or blockade of cox2a with NS-398, and these effects were rescued by exogenous addition of dmPGE2. In contrast, blockade of pdgh with Cay10397 results in a larger embryonic liver (37.4% embryos with a larger liver, n = 18 / 48), and this effect is even more pronounced in the presence of exogenous dmPGE2 (53.6% embryos with a larger liver, n = 28 / 52). Left lateral view. (G) Morpholino-mediated knockdown of PGE2 synthetic and degrading enzymes or PGE2 receptors alters liver development, as visualized by GFP fluorescence in lfabp:GFP embryos. Knockdown of synthetic enzyme pges (prostaglandin E synthase) abrogates liver development, and this effect can be rescued by exogenous addition of dmPGE2. In contrast, knockdown of the PGE2 degrading enzyme pgdh (15-hydroxy prostaglandin dehydrogenase) enlarges the developing liver, and this effect is even more dramatic with addition of exogenous dmPGE2. Knockdown of both cox1a and cox2a synthetic enzymes severely abrogates liver development, and this effect can be partially rescued by addition of exogenous dmPGE2. Knockdown of both ep2a and ep4a receptors results in nearly complete loss of the developing liver, and this effect cannot be rescued by exogenous dmPGE2. (n > 30 per condition). Left lateral view. (H) Modulation of cAMP and PKA activity impacts liver outgrowth. Relative liver size was quantified by [area] x [fluorescence intensity] in lfabp:GFP embryos after exposure to dmPGE2 or Indo in the presence or absence of H89, a PKA inhibitor, or Forskolin, a cAMP activator, from 48-72 hpf. Inhibiting PKA activity with H89 resulted in a smaller embryonic liver, whereas augmenting cAMP activity with Forskolin resulted in a larger embryonic liver. The effect of dmPGE2 to augment liver size was blunted in the presence of H89, and the effect of Indo to diminish liver size was blunted in the presence of Forskolin. (Data are represented as mean ± SEM; n e 20; significant by unpaired t-test comparing treatment vs. control, * p<0.05). |
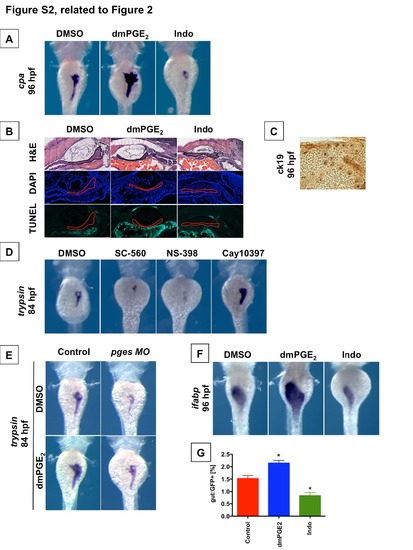
PGE2 affects Pancreas Development (Related to Figure 2) (A) In situ hybridization for carboxypeptidase A (cpa), an exocrine pancreas-specific marker, reveals that embryonic pancreas size is regulated by PGE2. Exposure to dmPGE2 from 48-96 hpf leads to a dramatic increase in embryonic pancreas size at 96 hpf, whereas exposure to Indomethacin severely abrogates embryonic pancreas development. Dorsal view. (B) Histological analysis reveals that modulation of PGE2 levels does not alter liver morphology (n = 5 / treatment). TUNEL analysis shows no apoptosis following modulation of prostaglandin activity (n = 5 / treatment). (C) Representative view of ck19 immunohistochemistry of the developing pancreas at 96 hpf in all treatment conditions. Low levels of ck19 are broadly expressed, and higher expression is just beginning to appear in developing pancreas ductules. (D) Pharmacologic blockade of PGE2 synthetic enzymes interferes with exocrine pancreas development, as visualized by in situ hybridization for trypsin. Blockade of cox1a with SC-560 or cox2a with NS-398 results in a smaller pancreas. In contrast, blockade of the PGE2 degrading enzyme pdgh with Cay10397 results in a larger embryonic pancreas. (n > 50 / treatment). Dorsal view. (E) Morpholino-mediated knockdown of PGE2 synthetic enzyme pges abrogates pancreas development, as visualized by in situ hybridization for trypsin expression. (n > 30 per condition). Left lateral view. (F) In situ hybridization for intestinal fatty acid binding protein (ifabp), a marker specific for the developing gut endoderm, reveals that PGE2 modulates the size of the embryonic intestine. Exposure to dmPGE2 from 48-96 hpf enlarges the developing intestine, whereas exposure to Indomethacin diminishes the size of the embryonic intestine. (n > 30 / treatment). Dorsal view. (G) Quantification of GFP+ cells by FACS of gut:GFP embryos at 96 hpf corroborates the findings of in situ hybridization in (F). Exposure to dmPGE2 from 48-96 hpf enlarges the developing intestine, whereas exposure to Indo abrogates intestinal development. (Data are represented as mean ± SEM). |
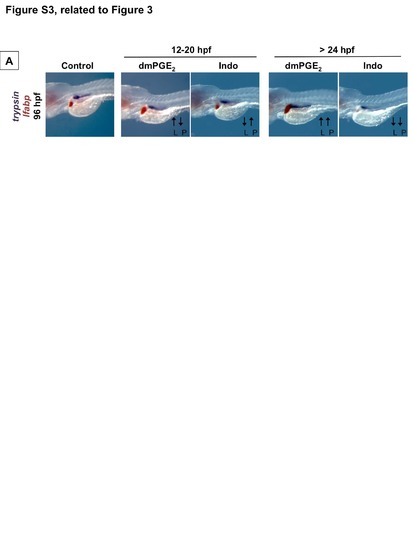
PGE2 influences Liver vs. Pancreas Specification (Related to Figure 3) (A) Double in situ hybridization for trypsin and lfabp at 96 hpf reveals reciprocal effects on organ size following exposure to dmPGE2 or Indo at 12-20 hpf. Early exposure to dmPGE2 or Indo results in opposing effects on the developing liver and pancreas. Left lateral view. |
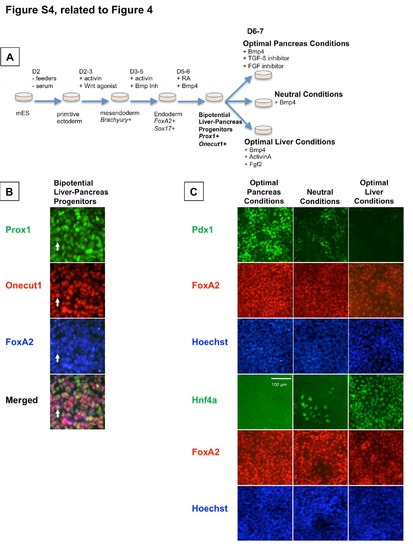
Liver vs. Pancreas Specification of Mouse Bipotential Endoderm Progenitors is Influenced by PGE2 (Related to Figure 4) (A) Mouse bipotential endodermal progenitors are derived from mouse embryonic stem cells by a step-wise differentiation protocol as shown. (B) Bipotential liver-pancreas endodermal progenitors are detected by triple co-staining for the hepatopancreatic markers Prox1 (green) and Onecut1 (red) as well as the pan-endoderm marker Foxa2 (blue). (C) Bipotential endodermal progenitors exposed to optimal pancreas conditions will be specified into a predominantly Pdx1+ population, whereas progenitors exposed to optimal liver conditions will be specified into a predominantly Hnf4α+ population. Scale bar = 100 µm. |
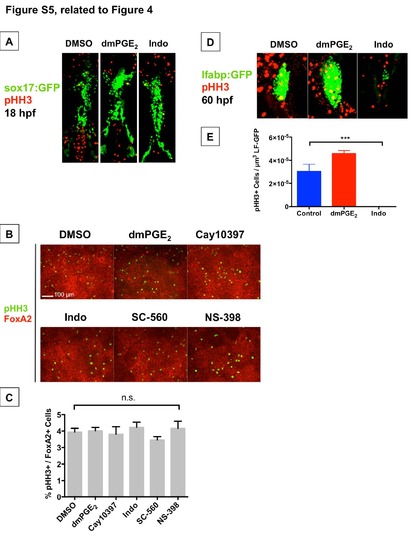
Impact of PGE2 on Proliferation during Liver vs. Pancreas Specification and during Liver Bud Outgrowth (Related to Figure 4) (A) Confocal microscopy analysis of pHH3+ cells (red) in sox17:GFP (green) endoderm reporter fish at 18 hpf following modulation of PGE2 levels from 12-18 hpf. The number of pHH3+ sox17:GFP+ cells (yellow) does not differ significantly across conditions (n = 3 / treatment; mean ± SEM for DMSO 13 ± 1.53, dmPGE2 15.7 ± 6.89 (p=0.7247), Indo 12.67 ± 2.40 (p=0.9125); significance by t-test vs. DMSO). (B,C) Quantification of proliferating cells by the percentage of FoxA2+ endoderm cells that are also pHH3+ after 18 hours of pharmacologic modulation of PGE2 levels in bipotential endoderm progenitors derived from mES cells. No statistically significant changes in proliferation were observed across treatment conditions (Data represented as mean ± SEM; n = 6 / treatment; mean ± SEM for DMSO 3.938 ± 0.231, dmPGE2 4.017 ± 0.210, Cay10397 3.811 ± 0.455, Indo 4.323 ± 0.312, SC- 560 3.461 ± 0.200, NS-398 4.166 ± 0.433; n.s. = not significant by unpaired t-test of each treatment condition vs. control). (D,E) Confocal microscopy analysis of pHH3+ cells (red) in lfabp:GFP (green) liver reporter fish at 60 hpf following modulation of PGE2 levels from 24-60 hpf. The number of pHH3+ cells within the liver bud is quantified in (E). Exposure to dmPGE2 increases cell proliferation in the liver bud, whereas exposure to Indo decreases cell proliferation in the liver bud (Data represented as mean ± SEM; n = 3 / treatment; ***p=0.0005; significance by ANOVA). |
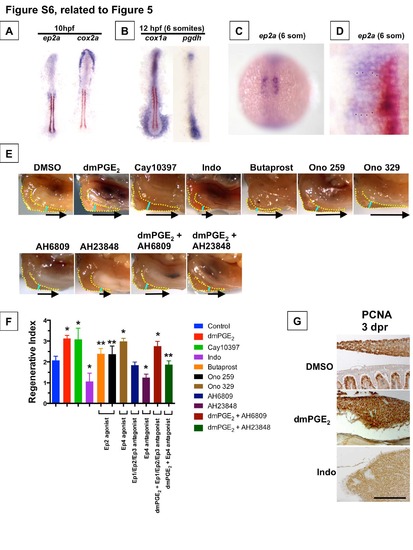
Prostaglandin Pathway Genes are Patterned to Regulate Endoderm Specification (Related to Figure 5) (A,B) Expression of ep2a, cox2a at 10 hpf, and cox1a and pdgh at 12 hpf as visualized by double in situ hybridization with myod (brown). (C) Expression of ep2a in a whole mount embryo at 12 hpf (6 somites). (D) Magnified expression of ep2a (purple) and myod (brown) at 12 hpf (6 somites), showing that expression of ep2a spans 4 cells from the midline. Each asterisk marks an individual cell. (E) Representative photomicrographs of adult zebrafish livers 3 days post-resection (dpr). The liver is highlighted by a yellow dotted line, the resection site by a blue line, and the arrow indicates the amount of liver regrowth. PGE2 activity mediated by ep4a is both necessary and sufficient to enhance liver regeneration. (F) Liver regeneration quantified as Regenerative Index = [Remnant + Regenerate (arrow)] / [Remnant] of the regenerating inferior lobe at 3 dpr. (Data represented as mean ± SD; * significant vs. control, ** significant vs. dmPGE2 exposure, t-test, p < 0.01, n=3-10 for each condition). (G) Visualization of proliferating cells marked by Proliferating Cell Nuclear Antigen (PCNA) in histologic sections of adult liver regenerates following hepatectomy and exposure to various agents modulating PGE2 activity. Exposure to dmPGE2 augments cell proliferation, whereas Indo abrogates cell proliferation. Proliferating cells in intestinal crypts can be seen in the DMSO panel. Black bar = 100 µm. |
Reprinted from Developmental Cell, 28(4), Nissim, S., Sherwood, R.I., Wucherpfennig, J., Saunders, D., Harris, J.M., Esain, V., Carroll, K.J., Frechette, G.M., Kim, A.J., Hwang, K.L., Cutting, C.C., Elledge, S., North, T.E., and Goessling, W., Prostaglandin E2 regulates liver versus pancreas cell-fate decisions and endodermal outgrowth, 423-437, Copyright (2014) with permission from Elsevier. Full text @ Dev. Cell