
- Title
-
The Nogo-C2/Nogo receptor complex regulates the morphogenesis of zebrafish lateral line primordium through modulating the expression of dkk1b, a Wnt signal inhibitor
- Authors
- Han, H.W., Chou, C.M., Chu, C.Y., Cheng, C.H., Yang, C.H., Hung, C.C., Hwang, P.P., Lee, S.J., Liao, Y.F., and Huang, C.J.
- Source
- Full text @ PLoS One
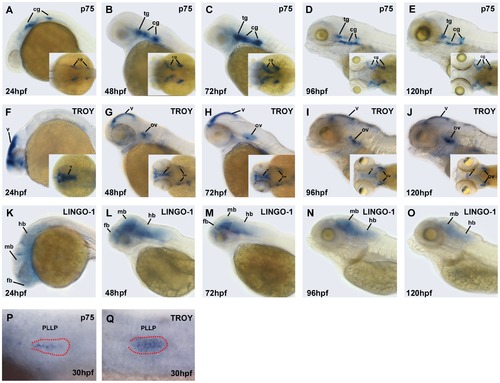
Expression patterns of Nogo co-receptor mRNAs in zebrafish embryos. Whole-mount in situ hybridization was performed with antisense probes against p75 (A–E; P), TROY (F–J; Q), and LINGO-1 (K–O) at the indicated developmental stages. Images were taken from the lateral view with the anterior to the left and the dorsal to the top, or from the dorsal view (inset). The PLL primordium is visible in the embryos with DIC optics, and labeled with red dots in panels (P) and (Q). fb, forebrain; mb, midbrain; hb, hindbrain; tg, trigeminal ganglion; cg, cranial ganglion; v, ventricle; ov, otic vesicle; PLLP, posterior lateral line primordium. |
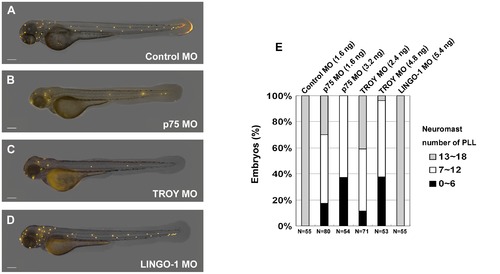
Morpholino knockdown of the Nogo co-receptors p75 and TROY resulted in defects in neuromast formation in the zebrafish lateral line. Zebrafish embryos at the 2~4-cell stage were injected with morpholinos (MOs) against zebrafish p75 (B), TROY (C), or LINGO-1 (D). Neuromasts in these morphants were stained with 4-Di-2-ASP at 72 h post-fertilization (hpf). An embryo injected with control MO is shown in panel (A). Images were taken from the lateral view, and the yellow dots indicate neuromasts of the lateral line. Scale bar, 100 μm. A summary of PLL neuromast numbers in MO-injected embryos is shown in panel (E). Sample size (N) and MO dosage used are indicated. PHENOTYPE:
|
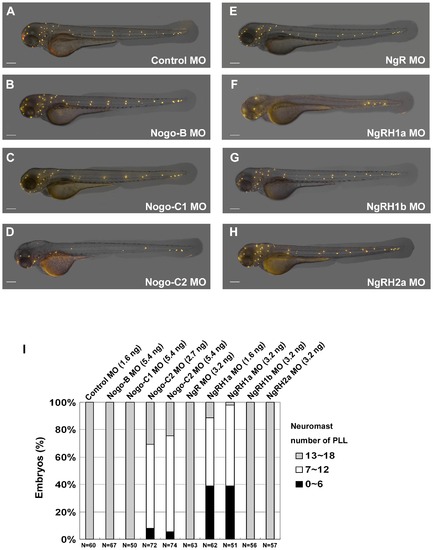
Defects in neuromast formation were observed in both Rtn4-m/Nogo-C2 and NgRH1a morphants. Zebrafish embryos were injected with morpholinos against the indicated zebrafish Nogo-related ligand or Nogo receptor at the 2~4-cell stage. Neuromast formation in these morphants was observed by staining with 4-Di-2-ASP at 72 h post-fertilization (hpf). A control embryo is shown in panel (A). Images were taken from the lateral view, and the yellow dots indicate neuromasts of the zebrafish lateral line. Scale bar, 100 μm. A summary of PLL neuromast numbers in MO-injected embryo is shown in panel (I). Sample size (N) and MO dosage used are indicated. PHENOTYPE:
|
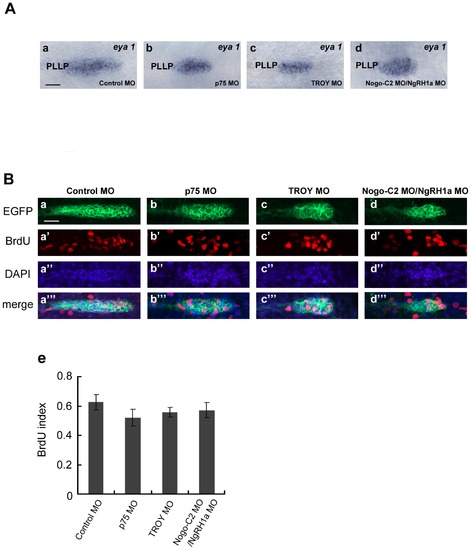
Although reduced in size, the PLL primordium of p75, TROY and Nogo-C2/NgRH1a morphants do not exhibit defects in cell proliferation. (A) PLL primordium in control (panel a) and morphant embryos (panels b–d) were labeled by whole-mount in situ hybridization with a probe against eya1. PLLP, posterior lateral line primordium. (B) Proliferating cells in PLL primordium were examined by BrdU incorporation. Each MO was injected into the CldnB::lynEGFP transgenic line, and BrdU incorporation assays were subsequently performed from 32.5 hpf. After incorporation, the embryos were fixed and immunostained with anti-GFP and anti-BrdU antibodies. Proliferating cells in the PLL primordium are shown in control embryos (panels a–a23), and p75 (b–b23), TROY (c–c23), and Nogo-C2/NgRH1a (d–d23) morphants. Nuclei were also stained with DAPI. Scale bar, 20 μm. The BrdU index (the ratio of BrdU-positive cells/total cells) was determined in MO-injected embryos (panel e). |
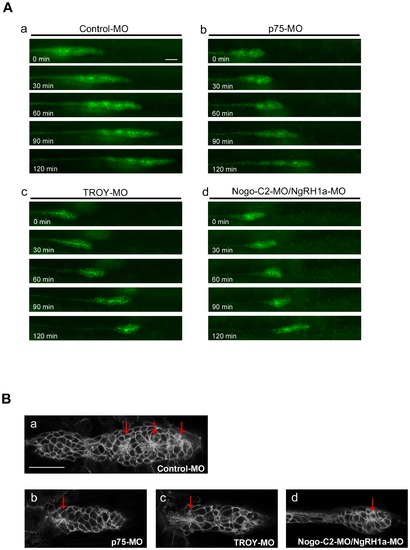
Knockdown of p75, TROY, or Nogo-C2/NgRH1a resulted in disordered morphogenesis of the PLL primordium during caudal migration. (A) Transgenic CldnB::lynEGFP zebrafish were injected with control MO (panel a), or MOs against zebrafish p75 (panel b), TROY (panel c), or Nogo-C2/NgRH1a (panel d), and time-lapse recording was then performed from 28 hpf. The morphology of PLL primordium in the morphants was unstable during migration, as shown at 30-min intervals (panels b–d). (B) Rosette formation in control (panel a), p75 (panel b), TROY (panel c), and Nogo-C2/NgRH1a (panel d) morphants. Rosettes are indicated by red arrows. Scale bar, 20 μm. |
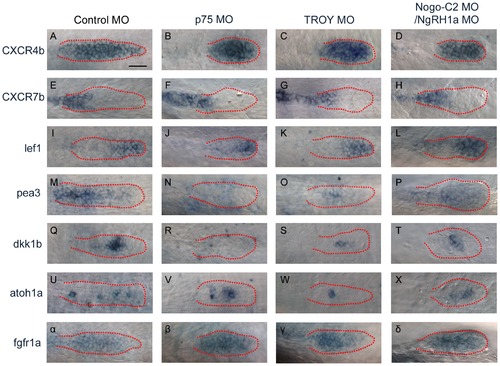
Morphants of p75, TROY, and Nogo-C2/NgRH1a with malformed PLL primordium exhibit decreased expression of downstream markers of Fgf signaling. Whole-mount in situ hybridization was performed with probes against markers of PLL primordium organization in control embryo and the indicated morphants. The expression patterns of cxcr4b (A–D), cxcr7b (E–H), and lef1 (I–L) were similar in control embryo and morphants. Expression of downstream markers of Fgf signaling (pea3 (M–P), dkk1b (Q–T), and atoh1a (U–X)) were reduced in all morphants examined as compared to the control. (α–δ) The expression pattern of fgfr1a in the PLL primordium was no different between the control and the morphants. Scale bar, 20 μm. |
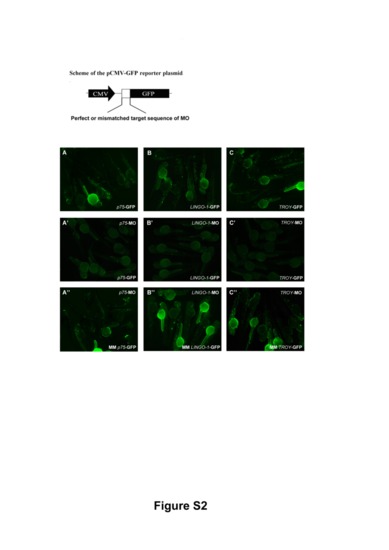
Control experiments for morpholino specificity. To confirm the specificities of the MOs against p75, LINGO-1, and TROY, pCMV-GFP reporter plasmids containing a perfect or mismatched MO target sequence were generated. The pCMV-GFP reporter plasmids bearing the perfect MO target sequence (mo-GFP) were injected into zebrafish embryos either alone (A–C) or together with the relevant MO (A2–C2). As controls, zebrafish embryos were co-injected with MO and pCMV-GFP reporter plasmid containing the mismatched target sequence (MM mo-GFP) (A3–C3). All images were taken from zebrafish embryos at 48 hpf. |
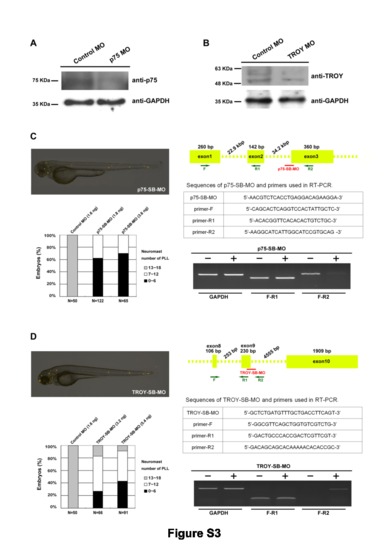
ATG-MOs reduced the protein levels of p75 and TROY, and splice-blocking MOs also affected PLL development. (A–B) Total proteins from (A) p75 and (B) TROY morphant embryos were collected at 24 hpf and subjected to Western blotting with anti-p75 (abcam, ab32888) or anti-TROY (Enzo, ALX-210-801) antibodies, as indicated. GADPH was used as a loading control. (C–D) Zebrafish embryos were injected with splice-blocking MOs against either (C) p75 or (D) TROY, and the neuromasts were stained with 4-Di-2-ASP at 72 hpf (upper left panels). The numbers of PLL neuromasts in these morphants at 72 hpf are summarized (lower left panels). The MO dosages used and sample numbers (N) are indicated. The efficiency and specificity of p75-SB-MO and TROY-SB-MO were verified by RT-PCR with two primer sets, as illustrated in the top right panels. The sequences of splice-blocking MOs and primers used in RT-PCR are provided. |
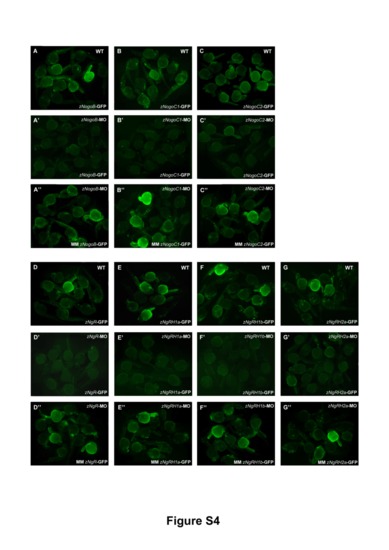
Control experiments for morpholino specificity. To confirm the specificities of the MOs against three Nogo ligands and four Nogo receptors, pCMV-GFP reporter plasmids containing a perfect or mismatched MO target sequence corresponding to that MO were generated. The pCMV-GFP reporter plasmids bearing the perfect MO target sequence (mo-GFP) were injected into zebrafish embryos either alone (A–G) or together with the relevant MO (A2–G2). As controls, zebrafish embryos were co-injected with MO and pCMV-GFP reporter plasmid containing the mismatched target sequence (MM mo-GFP) (A3–G3). All images were taken from zebrafish embryos at 48 hpf. |
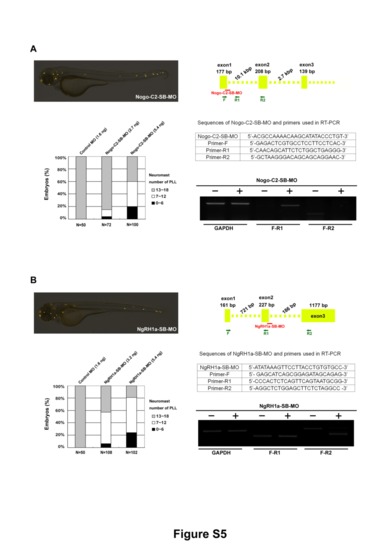
Splice-blocking MO against Nogo-C2 and NgRH1a also disrupted PLL development in zebrafish. Zebrafish embryos were injected with splice-blocking MOs against either (A) Nogo-C2 or (B) NgRH1a, and the neuromasts were stained with 4-Di-2-ASP at 72 hpf (upper left panels). The numbers of PLL neuromasts in these morphants at 72 hpf are summarized (lower left panels). The MO dosages used and sample numbers (N) are indicated. The efficiency and specificity of Nogo-C2-SB-MO and NgRH1a-SB-MO were confirmed by RT-PCR with two primer sets, as illustrated in the top right panels. The sequences of splice-blocking MOs and primers used in RT-PCR are provided. |
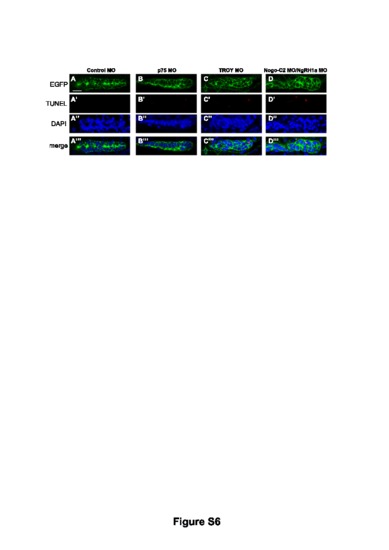
Non-specific MO-induced apoptosis was not observed in p75, TROY and Nogo-C2/NgRH1a morphants. Each MO was injected into the CldnB::lynEGFP transgenic line, and then collected the morphants with malformed PLL primordium at 26–34 hpf for TUNEL assay. One embryo at 30 hpf, representative of a large sample (n = 10), was shown. Apoptotic cells in PLL primordium in control embryos (panels A–A23), and p75 (B–B23), TROY (C–C23), and Nogo-C2/NgRH1a (D–D23) morphants were revealed by TUNEL staining in red. Nuclei were also stained with DAPI. Scale bar, 20 μm. |
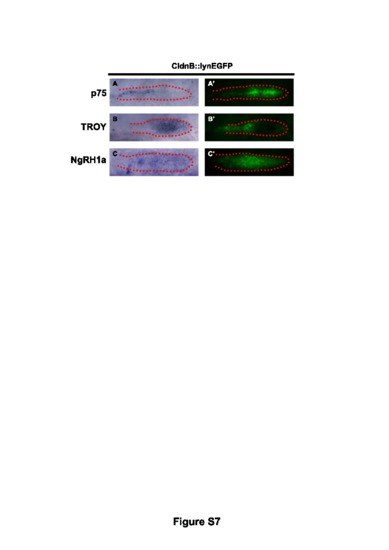
The mRNAs of p75, TROY and NgRH1a were expressed in the migrating primordium in zebrafish. Whole-mount in situ hybridization was performed with antisense probes against p75 (A), TROY (B), and NgRH1a (C) in CldnB::lynEGFP zebrafish at 30 hpf. The PLL primordium was simultaneously revealed by immunostaining with anti-GFP antibody (A2–C2). The PLL primordium is labeled with red dots. |