
- Title
-
Retinoic acid controls proper head-to-trunk linkage in zebrafish by regulating an anteroposterior somitogenetic rate difference
- Authors
- Retnoaji, B., Akiyama, R., Matta, T., Bessho, Y., and Matsui, T.
- Source
- Full text @ Development
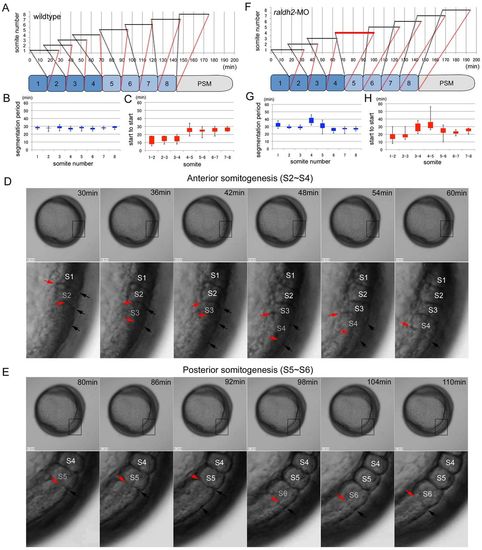
Knockdown of raldh2 results in a failure of AP transition. (A) Time-lapse data for somitogenesis in a wild-type zebrafish embryo (supplementary material Movie 1A,B). Black bars indicate periods between segmentation start and end. Successive segmentations overlap in somites 1-4. (B) Segmentation periods in wild-type embryos are constant. Segmentation periods (black bars in A) are extracted from wild-type embryos (n=9) and shown as box and whisker plots (minimum, 25% percentile, 75% percentile, and maximum). (C) Overlapping rates of segmentations differ between anterior somites 1-4 and posterior somites 5-8. Box and whisker plots of ‘start to start’, the interval between segmentation starts for one somite and the next, in wild-type embryos (n=9). (D) Typical images for anterior somitogenesis. Time-lapse images from 30 minutes to 60 minutes (6-minute intervals) in the wild-type zebrafish embryo (A) are displayed. Lower panel: higher-magnification views of boxed areas. Black arrows indicate the dorsal limit of the furrow of forming somite. Red arrows indicate the ventral limit of the furrow. Segmentations overlap in somites 2-4 (S2-S4). (E) Typical images for posterior somitogenesis. Time-lapse images from 80 minutes to 110 minutes (6-minute intervals) in the wild-type zebrafish embryo (A) are displayed. Lower panel: higher-magnification views of boxed areas. Black arrows indicate the dorsal limit of the furrow of newly formed somite. Red arrows indicate the ventral limit of the furrow. Segmentations in somites 5 and 6 (S5 and S6) occur sequentially. (F) Time-lapse data for somitogenesis in a raldh2 MO-injected embryo (supplementary material Movie 3A,B). The segmentation period of somite 4 (red bar) was longer than that of the wild-type embryo (A). (G,H) Box and whisker plots of segmentation period (G) or start to start (H) for raldh2 MO-injected embryos (n=10). raldh2 knockdown results in a prolonged segmentation period for somite 4 and the failure of proper AP transition. Results from statistical analyses are shown in supplementary material Tables S1-S4. PHENOTYPE:
|
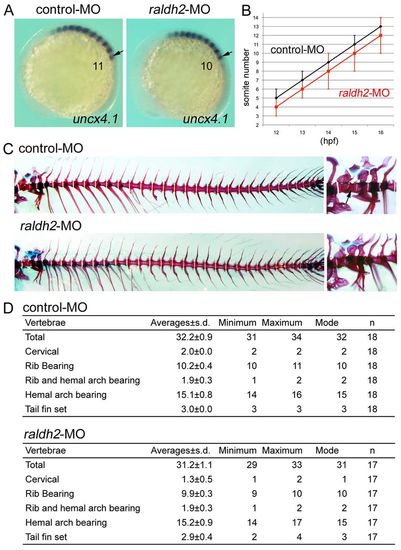
Knockdown of raldh2 leads to loss of a somite and the resultant second cervical vertebra. (A) Representative images of uncx4.1 expression in control MO- (left) or raldh2 MO-injected (right) embryos at 15 hpf. Lateral view, anterior to the left. Arrows mark the position at SI. (B) Somite numbers in control MO- (black; n=32, 45, 47, 47 and 48) or raldh2 MO-injected (red; n=34, 38, 55, 55 and 56) embryos at 12, 13, 14, 15 and 16 hpf. Error bars indicate s.d. raldh2 morphants lack one somite. (C) Representative images of skeletal structures in control MO-(upper panel) or raldh2 MO-injected (lower panel) fish at 1.5 months old. Bones (red) and cartilage (blue) are stained by Alizarin Red and Alcian Blue, respectively. Right: higher-magnification views of the cervical vertebrae (right panels). The second cervical bone (arrow in upper right image) forms in control MO-injected fish, but is missing in raldh2 MO-injected embryos (lower right). (D) Vertebra number in control MO- or raldh2 MO-injected fish. Results from statistical analyses are shown in supplementary material Tables S5, S6, S8. EXPRESSION / LABELING:
PHENOTYPE:
|

Relationship between her1 and ripply1 expression during gastrulation. (A) Representative images of her1 expression in control MO- (upper panel; n=33, 37 and 26) and raldh2 MO-injected embryos at 9, 10 and 11 hpf (lower panel; n=35, 29 and 21). Dorsal view, anterior to the top. The increase in stripe number for her1 expression in control embryos is delayed in raldh2 morphants (right graph). A statistically significant difference could be seen between embryos injected with control MO and raldh2 MO (P<0.05, P=0.29×10⁻⁶). (B) Double staining of her1 (red) and ripply1 (purple) in control MO- (upper panel) and raldh2 MO-injected (lower panel) embryos at 10 hpf. (C) Representative images of ripply1 expression in control MO- (upper panel) and raldh2 MO-injected (lower panel) embryos at 9 and 10 hpf. Ectopic expression of ripply1 could be observed in raldh2 morphants at 10 hpf (arrow) (P<0.05, P=0.50×10⁻⁷; right graph). (D) Representative images of her1 expression in control MO- (upper panel; n=58 and 52) and raldh2 MO + ripply1 MO-injected (lower panel; n=63, and 59) embryos at 9, 10 and 11 hpf. Dorsal view, anterior to the top. Decreased number of the her1 stripe in raldh2 morphants could be restored by co-injection of ripply1 MO (right graph). A statistically significant difference was observed in embryos (10 hpf) injected with raldh2 MO versus embryos (10 hpf) injected with raldh2 MO + ripply1 MO (P<0.05, P=0.42×10⁻⁵), but not in embryos (10 hpf) injected with control MO versus embryos (10 hpf) injected with raldh2- MO + ripply1 MO (P>0.05, P=0.12). EXPRESSION / LABELING:
|
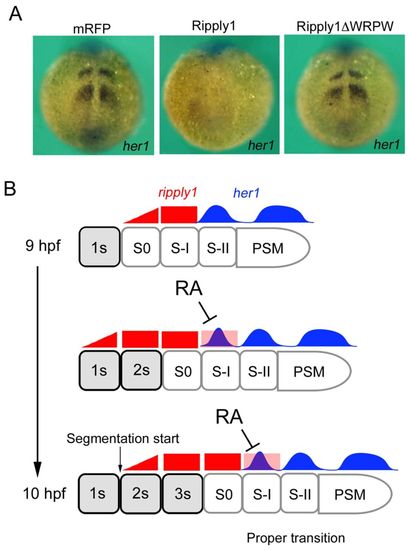
Proposed mechanism for the proper transition from anterior to posterior somitogenesis.her1 expression in embryos at 12 hpf overexpressing mRFP (n=40), Ripply1 (n=32) or Ripply1ΔWRPW (n=38). Overexpression of Ripply1, but not Ripply1ΔWRPW, inhibited her1 expression in the PSM at 12 hpf. (B) Proper transition between anterior and posterior somitogenesis. RA inhibits ripply1 expression at the S-I position, leading to a proper increase in the number of her1 stripes by 10 hpf. This allows the transition of anterior and posterior somitogenesis to occur normally. This regulation is required to control somite number and proper linkage between head and trunk during zebrafish development. |
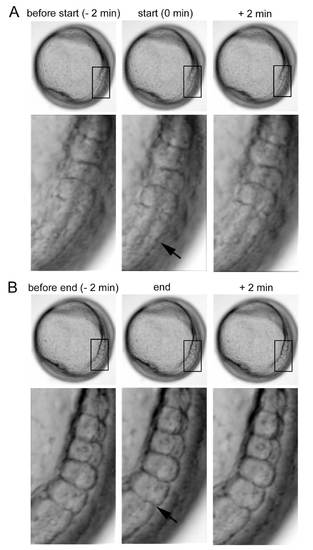
Start and end of somite segmentation. (A) Representative images of segmentation start. Lateral view, dorsal to the right. Lower panel: higher-magnification views of boxed areas. A furrow (arrow) appeared at the dorsal limit of the presomitic mesoderm at 0 min. Two min later, the furrow became clearer. (B) Representative images of segmentation end. Lower panel: higher-magnification views of boxed areas. The somite boundary (arrow) became clearer, and the somite and presomitic mesoderm were completely separated. Panels are frames of Movie 1. |
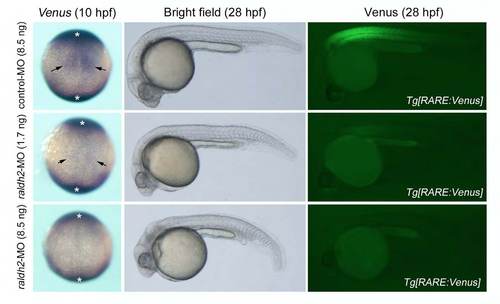
Knockdown efficiency of raldh2 evaluated by using Tg[RARE:Venus] embryos. Left panel: Representative images of Venus expression in 10 hpf embryos injected with 8.5 ng control-MO (n = 42), 1.7 ng raldh2-MO (n = 34) or 8.5 ng raldh2-MO (n = 38). Dorsal view, anterior to the top. in situ signal marked by asterisk was considered as a background signal because similar signal could be detected in wildtype embryos and because raldh2 is not expressed in these regions. Center and right panel: Representative images of Venus expression in 28 hpf embryos injected with 8.5 ng control-MO (n = 57), 1.7 ng raldh2-MO (n = 34) or 8.5 ng raldh2- MO (n = 41). Lateral view, anterior to the left. RA signal activity (Venus signals) could be seen at a part of paraxial mesoderm (arrow) in control embryos at 10 hpf, and at anterior somites and eyes in control embryos at 28 hpf (upper panels). The activity was detected weakly in embryos injected with 1.7 ng raldh2-MO (middle panels), but not in embryos injected with 8.5 ng raldh2-MO (lower panels). |
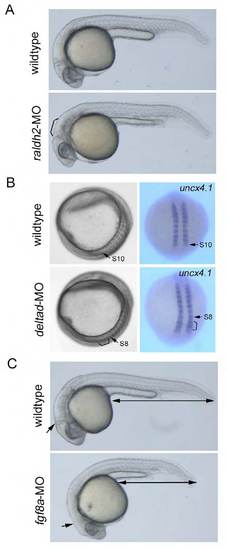
Evaluation of MO activity after time-lapse imaging. (A) raldh2 morphants. Embryos (24 – 30 hpf) showing defects in hindbrain (bracket) and trunk somites were selected and used to further analyses. (B) deltad morphants. Embryos (14 hpf) which phenocopy after eight (deltad mutants) were selected. In these embryos, segmentation defects could be seen around S8 – 10 (bracket). (C) fgf8a morphants. Embryos (24 – 30 hpf) that phenocopy ace (fgf8a mutants) were selected. Defects in midbrain-hindbrain boundary (arrow) and tail elongation (double arrow) could be seen in phenocopied embryos. |
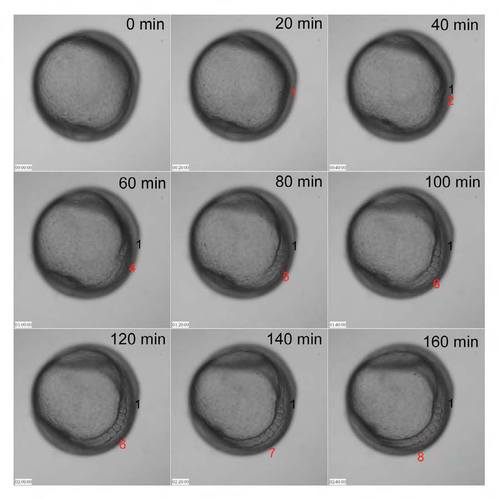
A difference between anterior and posterior somitogenesis. Time-lapse images every 20 min are displayed. The first somite (numbered 1) and the newest somite at each time point (red) are indicated. Panels are frames of Movie 1. |
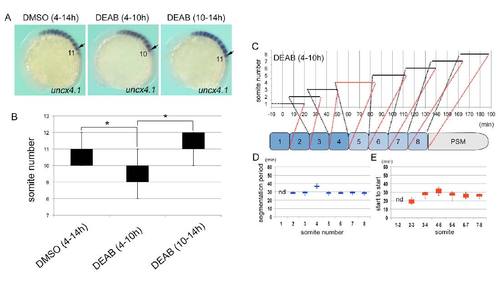
Inhibition of RA synthesis during gastrulation results in loss of a somite. (A) Representative images of uncx4.1 expression in embryos treated with DMSO (4 – 14 hpf) (left), DEAB (4 – 10 hpf) (center) or DEAB (10 – 14 hpf) (right). Lateral view, anterior to the left. Arrows marked the position at SI. (B) Box and whisker plots of somite number in embryos treated with DMSO (4 – 14 hpf) (n = 34), DEAB (4 – 10 hpf) (n = 29) or DEAB (10 – 14 hpf) (n = 25). Statistically significant difference (asterisk, P < 0.05) could be seen in DMSO versus DEAB (4 – 10 hpf), and DEAB (4 – 10 hpf) versus DEAB (10 – 14 hpf). (C) Time-lapse data for somitogenesis in an embryo treated with DEAB (4 – 10 hpf) (see Movie 4, 4-1). (D, E) Box and whisker plots of segmentation period (D) or start to start (E) for embryos treated with DEAB during 4 – 10 hpf (n = 8). Results from statistical analyses are shown in Table S1 – 4. |
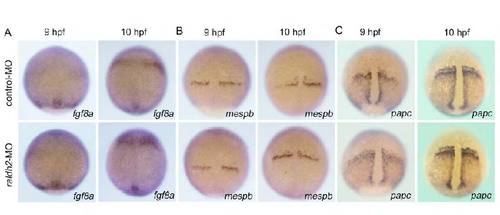
raldh2 knockdown does not affect expression of fgf8a, mespb or papc. Expression of fgf8a (A), mespb (B) or papc (C) in control (upper) or raldh2 morphants (lower) at 9 (left) or 10 hpf (right). |