
- Title
-
Genome wide analysis reveals zic3 interaction with distal regulatory elements of stage specific developmental genes in zebrafish
- Authors
- Winata, C.L., Kondrychyn, I., Kumar, V., Srinivasan, K.G., Orlov, Y., Ravishankar, A., Prabhakar, S., Stanton, L.W., Korzh, V., and Mathavan, S.
- Source
- Full text @ PLoS Genet.
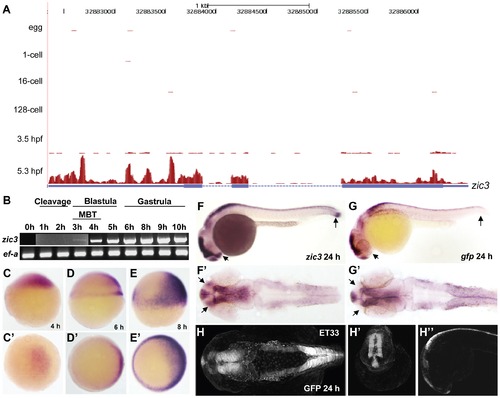
Early expression of zic3 as detected by RNA-seq and RT-PCR. A, UCSC browser image showing RNA-seq reads (pink vertical histograms) at the zic3 locus (in blue; tall boxes - exons; half-height boxes - UTRs; lines - introns; arrowheads - direction of transcription). B, RT-PCR detection of zic3 transcripts in zebrafish embryo. Portion of image showing expression at 1 hpf to 3 hpf was enhanced to show weak band at 3 hpf. C, D and E, zic3 expression in 4 hpf, 6 hpf, and 8 hpf embryos. Lateral view, dorsal to the right. C2, D2 and E2, animal pole view. F, G, zic3 expression in wild-type and gfp in SqET33 embryos at 24 hpf. F2, G2, dorsal view. Note the absence of gfp expression from the olfactory bulb and presomitic mesoderm domains of the wild-type zic3 expression (arrows). H–H3, GFP expression in live SqET33 embryos at 24 hpf. H, dorsal view, H2, frontal view, H3, lateral view. |
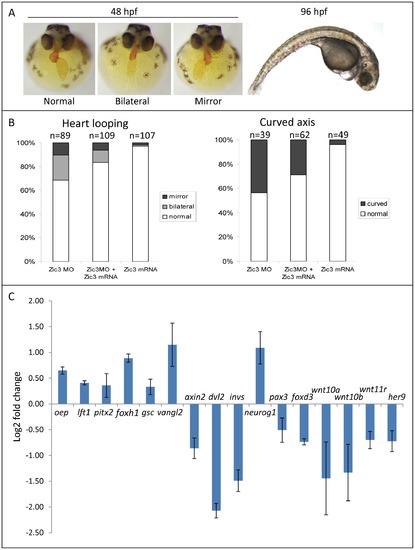
Zebrafish phenotype as a result of Zic3 knock-down. A, MF-20 antibody staining of heart, showing normal, bilateral, and reversal of looping at 48 hpf. Curvature of body axis and edema of the heart in Zic3 morphants at 96 hpf. B, percentage of embryos with heart laterality and axis curvature defects observed at 48 hpf in embryos injected with Zic3 MO alone, Zic3 MO and Zic3 mRNA, and Zic3 mRNA alone. C, expression levels of selected marker genes measured by qRT-PCR. Assay was performed in three independent groups of embryos injected with 3.4 ng of Zic3 morpholino. Marker genes oep through invs was assayed at 8 hpf, neurog1 at 10 hpf, and pax3 through her9 at 24 hpf. |
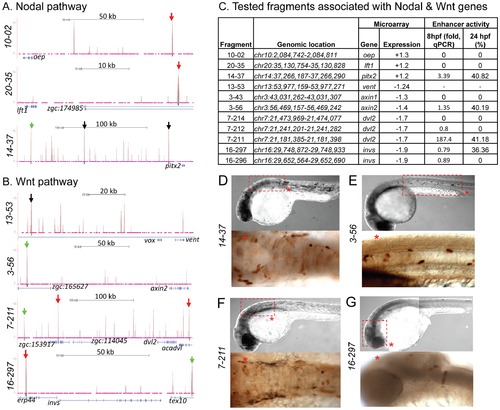
Zic3 binding sites associated with genes from the Nodal and Wnt pathway genes. UCSC browser image depicting genomic locations of Zic3 peaks identified near Nodal (A) and Wnt (B) pathway genes at 8 hpf. Single black vertical bars below histogram - peaks called by QuEST algorithm, blue horizontal bars - annotated exons (tall boxes), UTRs (half-sized boxes), introns (lines, arrowheads denote transcript orientation); Zic3 binding sites with negative (red arrows) and positive (green arrows) enhancer activity. Scale bars are indicated by black horizontal line at the top of each panel. C, list of tested fragments associated with Nodal and Wnt pathway genes. Enhancer-driven expression was assayed by qRT-PCR of gfp at 8 hpf and through microscopic observation of GFP expression pattern at 24 hpf. Between 50 to 100 embryos were assayed in each experimental time point. D–G, representative figure of gfp expression driven by selected fragments of Zic3 binding sites in F0 embryos at 24 hpf, immunostained with anti-GFP antibody. D*, F*, dorsal view; E*, G*, lateral view. |
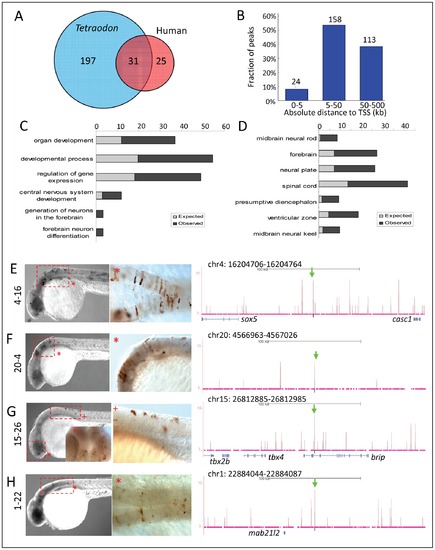
Zic3 regulates neural-specific expression through CNEs. A, number of CNEs found among the Zic3 peaks. A large subset was conserved between zebrafish and Tetraodon, while a smaller subset was conserved between zebrafish and human. B, distribution of CNE peaks with regards to their distance from TSS of genes. Enrichment of biological process (C) and tissue-specific expression (D) terms among genes associated with CNE peaks. Light and dark grey bars represent expected and observed enrichments of functional categories according to DAVID GO terms. E–H, representative figure of 24 hpf F0 embryos expressing gfp (left panel) driven by Zic3 CNE peaks shown in UCSC browser image (right panel, green arrows); black horizontal line at the top of each panel represents 100 kb. E*, H*, dorsal view; F*, G*, lateral view. |
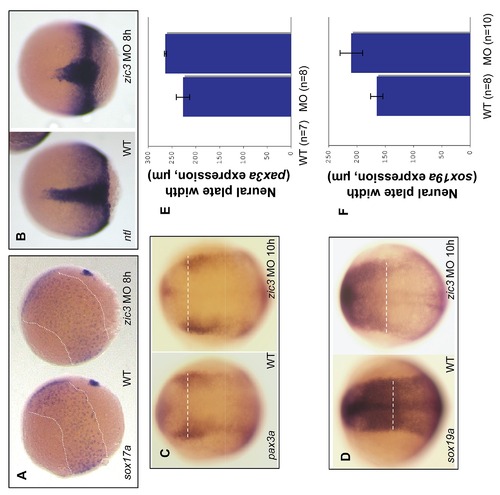
Defects in cell fate specification and convergent-extension movement in Zic3 knockdown embryos. A, WISH of sox17a expression shows the expansion of the mesendoderm territory (marked by dashed line) in Zic3 morphants. B, WISH of ntla in the notochord at 8 hpf in control and Zic3 morphants. C–D, WISH of pax3a and sox19a at 10 hpf to label the neural plate border. Dashed line marks the width of neural plate. E–F, average width of the neural plate was measured at the dashed line in control and Zic3 morphants. Error bars represent standard deviation. |
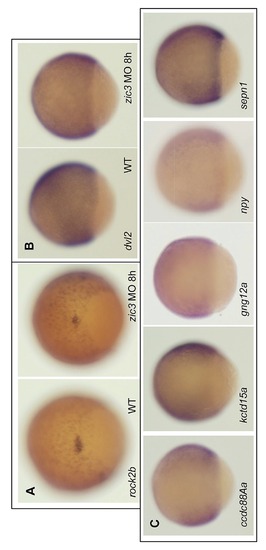
WISH of Zic3 target genes. A, WISH of rock2b shows the reduction of expression domain in the dorsal forerunner cells in Zic3 morphant embryos. B, WISH of dvl2 in control and Zic3 morphant embryos. C, WISH of representative Zic3 target genes at 8 hpf whose expression were downregulated in Zic3 knockdown embryos. Dorsal is to the right. |
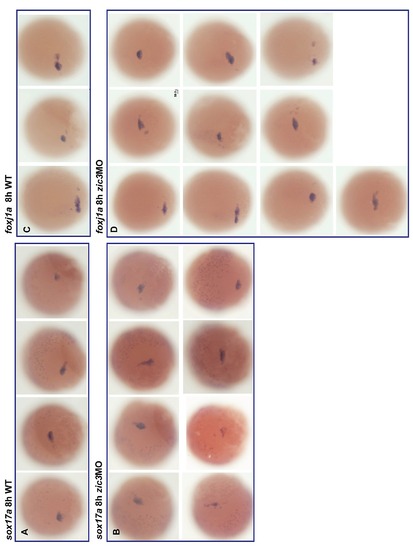
Effect of Zic3 knockdown in migration of the dorsal forerunner cells. Expression of sox17a (A–B) and foxj1a (C–D) marks the dorsal forerunner cells in controls and Zic3 morphant embryos at 8 hpf. |