
- Title
-
Local dkk1 crosstalk from breeding ornaments impedes regeneration of injured male zebrafish fins
- Authors
- Kang, J., Nachtrab, G., and Poss, K.D.
- Source
- Full text @ Dev. Cell
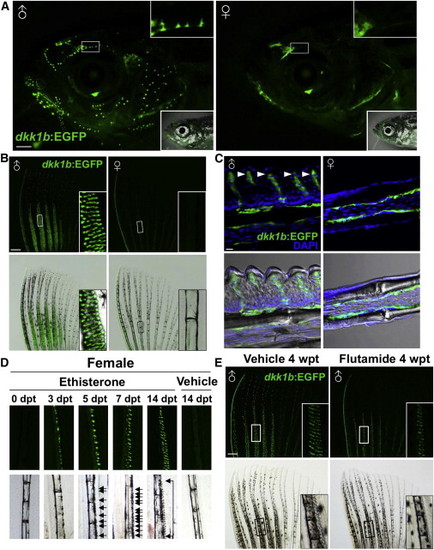
The Secreted Wnt Signaling Inhibitor Dkk1b Is Produced by Androgen-Dependent Male ETs (A) Sexually dimorphic dkk1b:EGFP expression in the heads of adult male (left) and female (right) zebrafish, present in constellations of ETs. Insets at top display enlarged version of area in white boxes. Insets at bottom indicate bright-field images. Scale bar, 1 mm. (B) dkk1b:EGFP expression in male and female pectoral fins. Only male fins contain prominent ETs on anteromedial rays. Insets display enlarged version of area in white boxes. Note that the exterior of the anterior fin ray also expresses dkk1b:EGFP. Scale bar, 500 μm. (C) Confocal images of longitudinal sections through dkk1b:EGFP pectoral fins, indicating male-specific ET domains (arrowheads). Both sexes display faint expression in the osteoblast compartment, although it is difficult to detect in some sections. Scale bar, 10 μm. (D) Fluorescent (top) and bright-field (bottom) images of adult female pectoral fin rays after Eth treatment for the indicated durations. dkk1b:EGFP is detectable at 3 dpt, and ETs (arrows) are detectable at 5 dpt. (E) Flutamide treatment decreased the number of ETs in male dkk1b:EGFP pectoral fins and reduced their definition. Insets display enlarged areas from white or black boxes. wpt, weeks posttreatment. Scale bar, 500 &mum. |

Male Pectoral Fins and ETs Are Important Breeding Structures (A) Still images of zebrafish mating behavior acquired by high-speed video. In the parallel swimming image, the male chases the female and attempts to align in a parallel position. In the grasping images, the male positions one of his pectoral fins below the female abdomen, while placing his posterior trunk over that of the female. In the contortion images, the male bends his body, arching away from the female. In the egg laying image, these activities by the male stimulate egg release (arrowhead). Inset, enlargement of male pectoral fin. Dotted lines indicate male pectoral fin. (B) Pie charts of mating test after complete fin amputations as indicated in cartoons. Cau, Anal, and Pec indicate full (>90%) amputation of caudal, anal, and pectoral fins, respectively. n = 12 to 22 animals. The top p value is calculated from Fisher’s exact test between the “no amputation” control and the experimental group for the percentage of successful matings, with one or more embryos considered successful (none versus more than one embryo). The bottom p value is calculated from Fisher’s exact test between the no-amputation control and the experimental group for the percentage of successful matings, with ten or more embryos considered successful (zero to ten embryos versus more than ten embryos). As zebrafish typically have 50–200 embryos per mating, a clutch size of one to ten embryos is unusually small and of borderline success. (C) Pie charts showing results of mating tests after various fin injuries, indicated by the cartoons above the charts, were given to male zebrafish. Asterisks denote experiments in which all fins except pectoral fins were amputated. n = 17 to 22 animals. |

Induction of De Novo Formation of ETs by Androgen and Wnt Signaling (A) Section images of the dorsal side of a female pectoral fin after the indicated duration of androgen treatment. Dashed lines indicate the outer epidermal border (left and middle images) or individual ETs (right images). Note that local epidermal thickening is observed by 2 dpt. Scale bar, 10 μm. (B and C) Whole-mount (B) and section (C) images of female TCFsiam; dkk1b:EGFP pectoral fins after 2 days of androgen treatment. Arrows indicate dkk1b:EGFP expression in basal layers in forming ETs. Dotted line outlines an ET precursor, with one middle cell expressing weak TCFsiam. Scale bar in (C), 10 μm. (D and E) Whole-mount (D) and section (E) images of female TCFsiam;dkk1b:EGFP pectoral fins after 7 days of androgen treatment. ETs show stage-specific expression profiles. Putative newly forming ETs express TCFsiam (Class I, arrow). Putative immature ETs show both TCFsiam and dkk1b:EGFP expressions (Class II, asterisks). Mature ETs express only dkk1b:EGFP or both TCFsiam and dkk1b:EGFP (Class III, arrowheads). Note that TCFsiam expression is weak in mature ETs. Scale bar in (E), 50 μm. (F) LiCl treatment increases formation of ETs in androgen-treated adult females. Data are mean ± SD. p < 0.05 by two-tailed Student’s t test. (G and H) Ubiquitous overexpression of dkk1b blunts ET formation in androgen-treated adult females (G) and juvenile males (H). Arrows indicate developing ETs in (G). Data are mean ± SD. p < 0.001 by two-tailed Student’s t test. |
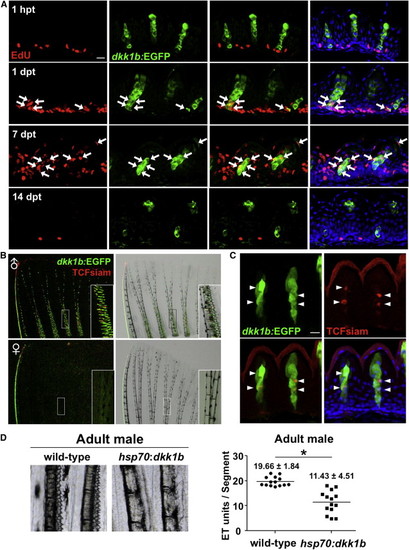
Male Pectoral Fin ETs Undergo Vigorous Renewal (A) Section images of male dkk1b:EGFP pectoral fin ETs at 1 hr, 1 day, 7 days, or 14 days after EdU injection. Arrows indicate EdU+dkk1b:EGFP-expressing cells. Green indicates enhanced green fluorescent protein (EGFP) immunofluorescence, red indicates EdU immunofluorescence, and blue indicates DAPI. Scale bar, 10 μm. (B) Whole-mount images of TCFsiam; dkk1b:EGFP pectoral fins. Males expressed both reporters in ETs. (C) Section image of maleTCFsiam; dkk1b:EGFP pectoral fin ETs. Arrowheads indicate TCFsiam+ cells. Cuticle shows red autofluorescence in these images. Scale bar, 10 μm. (D) Ubiquitous overexpression of dkk1b decreased the number of ETs in male pectoral fins and reduced their definition. Data are shown as mean ± SD. p < 0.001 by two-tailed Student’s t test. |
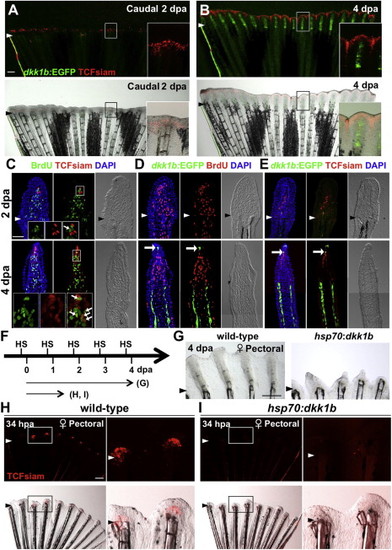
Blastema Formation Involves Wnt Target Gene Activation and Dkk1b Attenuation (A and B) Female TCFsiam; dkk1b:EGFP caudal fins at 2 dpa (A) and 4 dpa (B), shown as whole-mount images. TCFsiam is expressed in distal regions during regeneration. dkk1b:EGFP is not detectable at 2 dpa but is evident in regenerates 4 dpa. Arrowheads indicate amputation plane. Scale bar in (A), 500 µm. (C) Section images of female TCFsiam caudal fins at 2 (top) or 4 dpa (bottom). TCFsiam is expressed in a subset of cells in the distal portion of the blastema, some of which are BrdU-positive 30 min after treatment. Arrows indicate BrdU+ and TCFsiam+ cells. Amputation site in 4 dpa is proximal to imaged area. Scale bar for (C) through (E), 50 μm. (D) Section images of female dkk1b:EGFP caudal fins at 2 dpa (top) or 4 dpa (bottom). dkk1b:EGFP is not detectable at 2 dpa. At 4 dpa, it is expressed in a very small domain at the distal tip of the regenerate (arrow) and in more proximal areas of osteoblast patterning. Expression domains are adjacent to areas of low BrdU incorporation (red), but not to more proliferative blastemal mesenchyme. (E) Section images of female TCFsiam; dkk1b:EGFP caudal fins at 2 (top) or 4 dpa (bottom). dkk1b:EGFP+ cells at the distal tip of the regenerate at 4 dpa colocalize with TCFsiam (arrow). (F) Experimental design for experiments testing effects of heat-induced overexpression of dkk1b during regeneration. (G) Whole-mount images of 4 dpa wild-type and hsp70:dkk1b female pectoral fin regenerates, indicating that overexpression of dkk1b inhibits regeneration. n = 6. Scale bar, 500 μm. (H and I) Whole-mount images of wild-type (H) and hsp70:dkk1b (I) female pectoral fin regenerates at 34 hpa, indicating that dkk1b overexpression blocks induction of TCFsiam in the newly formed blastema. n = 6. Scale bar in (H), 500 μm. |

Evidence that Dkk1b-Producing ETs Inhibit Blastema Formation after Fin Amputation (A) Whole-mount image of male pectoral fin (left). Quantification of intrafin ratio of regenerate lengths at 4 dpa (right). The ratio of anterior (Ant) ray length to posterior (Pos) ray length was calculated separately for each animal as indicated. Regeneration of male anterior regions was inhibited when fins were amputated through regions containing proximal ETs (P and Prox; 50% amputation) but not through distal regions (D and Dis; 10%–20% amputation). Arrowheads indicate amputation planes. n = 18, mean ± SD. p < 0.001 by one-way analysis of variance (ANOVA) with Bonferroni posttest. (B) Quantification of intrafin ratio in adult females after 14 days of treatment with Eth, followed by 1 day of washout. Conditions that stimulated formation of dense dkk1b:EGFP+ ETs were sufficient to inhibit regeneration of female anterior fin regions. n = 16. Data are mean ± SD. p < 0.001 by two-tailed Student’s t test. (C) Whole-mount images of TCFsiam; dkk1b:EGFP pectoral fins at 2 dpa. TCFsiam expression is detectable in female pectoral fin blastemas (bottom) and male pectoral fins (top, b). By contrast, TCFsiam expression is low or undetectable in anterior blastemas of male pectoral fins (top, a). Below the “Male” panel are enlargements of the boxed areas a and b. Panels at the bottom show enlargements of the boxed area in the “Female” panel directly above them. Scale bar, 500 μm. (D) Section images showing stunted male pectoral fin regeneration at 2 dpa, with dkk1b:EGFP+ ETs within and just dorsal to the wound epidermis (asterisk). By 4 dpa, regenerates are dysmorphic, typically angling ventrally away from dkk1b:EGFP+ ETs before overcorrecting dorsally. Scale bar, 50 μm. |

Long-Term Regenerative Defects Inhibit Male Spawning (A) Whole-mount images of pectoral fins at 2 months postamputation (mpa). Good indicates that all fin rays between the first to sixth fin rays have completely regenerated. Mild indicates that one to three fin rays between the first to sixth fin rays show defective regeneration. Severe indicates that at least four of six fin rays between the first to sixth fin rays failed to regenerate normally. Arrowheads indicate amputation planes. Scale bars, 500 μm. (B) Cartoon summarizing experiments in which mating tests were performed 1–2 months after amputation. (C) Pie charts with results of mating tests 1–2 months after amputation of caudal or pectoral fins, with each pectoral fin scored after mating as in (B). Males that regenerated more effectively stimulated better laying than those with defective regeneration. n = 13 to 75 animals. The top p value is calculated from Fisher’s exact test between the no-amputation control and the experimental group for the percentage of successful matings, with one embryo or more considered successful (none versus more than one embryo). The bottom p value is calculated from Fisher’s exact test between the no-amputation control and the experimental group for the percentage of successful matings, with ten or more embryos considered successful (zero to ten embryos versus more than ten embryos). |
|

Sexually Dimorphic dkk1b:EGFP Expression Patterns (A) Whole-mount images of male and female dkk1b:EGFP trunks. Males have many dkk1b:EGFP+ scale features, although posterior scales have much less. Both sexes show dkk1b:EGFP expression affiliated with bone. (B) Whole-mount images of dkk1b:EGFP dorsal, anal, and pelvic fins. dkk1b:EGFP+ ET are present on distal fin regions in males, but not females. Male caudal fins do not have detectable dkk1b:EGFP+ ET. Insets show higher magnification views of ET in male fins. Note that the exterior of the anterior fin ray in dorsal, anal, and pelvic fins expresses dkk1b:EGFP, as well as the most dorsal and ventral rays of the caudal fin. (C) (Left) Whole-mount images of pectoral fins from 4-6-month-old AB, Wik and Tuebingen (Tu) strain males. All tested male strains had pectoral fin ET. (Right) Quantification of average numbers of ET per fin. n = 6 fins for each strain. Data are mean ± s.d.*P < 0.05, **P < 0.001 by two-tailed Student’s t-test. (D) dkk1b:EGFP expression patterns at 4 weeks post-fertilization (wpf). At 4 wpf, dkk1b:EGFP+ cells are located near bone in the trunk (Top) and pectoral fins (Bottom). (E) dkk1b:EGFP+ pectoral fins at 6 and 8 weeks post-fertilization (wpf), when malespecific ET begin to become prominent. Insets are high magnification views of boxes. (F) dkk1b:EGFP+ ET are detectable in the head and scales of male zebrafish at 8 wpf. Insets are high magnification views of boxes. (G) Quantification of the average number of ET per ray segment, from 4 quantified segments per fish. ET were counted from two segments located just proximal to the bifurcation point on the 3rd and 4th fin rays (from the anterior). (H) Quantification of mean dkk1b:EGFP fluorescence in ET (see Materials and Methods). n = 6. Data are mean ± s.d. *P < 0.05, **P < 0.001 by two-tailed Student’s t-test. Scale bars = 1 mm (A, B, D, E); 500 μm (F) |
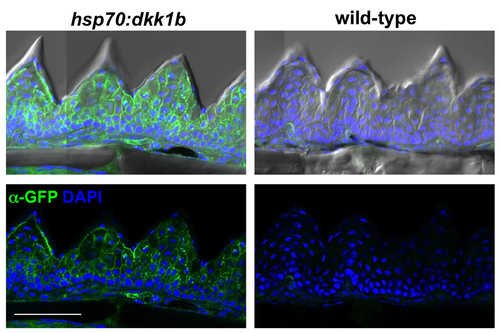
Ubiquitous Dkk1b-GFP Expression in hsp70:dkk1b ET After a Single Heat-Shock Wild-types did not show GFP signal after heat-shock. An antibody was used to detect GFP in this experiment. Scale bar = 50 μm |

Rigid Keratinized Cuticles of Male Pectoral Fins (A) Image of cuticles discarded from male pectoral fins after breeding. (B) Section images of male pectoral fin. Arrow in inset points to cuticle cell nucleus. Scale bars = 100 μm (A); 50 μm (B) |
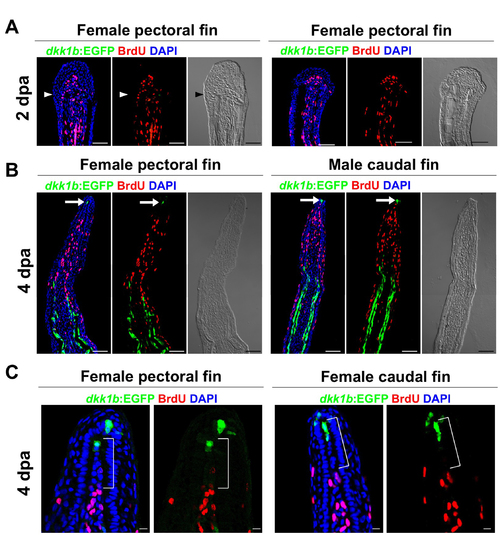
Additional Confocal Images of dkk1b:EGFP Expression During Fin Regeneration (A) dkk1b:EGFP is low or undetectable at 2 dpa (blastema formation). (B) dkk1b:EGFP expression during female pectoral fin (left) and male (right) caudal fin regeneration at 4 dpa (regenerative outgrowth). dkk1b:EGFP is expressed in a small cluster of cells located in and near the distal-most regions of the blastema Kang, page 6 (arrows) at 4 dpa, and in areas of osteoblast patterning. Note that dkk1b:EGFP expression is associated with non-proliferative (BrdU+) regions. Amputation sites are proximal to imaged areas in (B). (C) High-magnification view of the distal tips of regenerating fins at 4 dpa. Brackets indicate a region of BrdU-low mesenchyme underlying the dkk1b:EGFP domain. Green: EGFP immunofluorescence; red: BrdU immunofluorescence; blue: DAPI. Scale bars = 50 μm (A, B); 10 μm (C) |

Additional Evidence that Dkk1b-Producing ET Inhibit Regeneration (A) Quantification of regenerate lengths after distal amputations of 10-20% of pectoral fins. n = 18. Data are mean ± s.d. ‘N.S.’: not significant. (B) Quantification of regenerate length after proximal amputation of 50% of pectoral fins. n = 18. Data are mean ± s.d.*P < 0.001 by one-way ANOVA with Bonferroni’s posttest.(D-E) Additional confocal images of dkk1b:EGFP in amputated anterior regions of male pectoral fins. (D) dkk1b:EGFP+ET cells are located over and/or dorsally adjacent to the amputation place. Note that there are only few BrdU+ proliferating cells (red) near the amputation plane. (E) dkk1b:EGFP expression in dysmorphic 4 dpa regenerates. Proliferation appears to be directed away from dkk1b:EGFP+ET. Green: EGFP immunofluorescence; red: BrdU immunofluorescence; blue: DAPI. Scale bars = 50 μm. (F) Increased expression of dkk1b in the anterior regions of 2 dpa male pectoral fin tissue compared with females, as assessed by quantitative PCR (n = 3). Error bars indicate standard deviation. Data are normalized to actb2 (beta-actin2). AU = arbitraty units. *P < 0.05 by two tailed Student’s t-test. (G) axin2 expression at 2 dpa in female (Left) and male (Right) pectoral fins, as assessed by in situ hybridization. Note that axin2 (violet) is clearly detectable in the female regenerate, but weak in the male sample. Arrowheads indicate amputation plane. amputations through the ET field, but not after amputation distal to the ET field. Note that growth rates during fin regeneration are position-dependent, with distal regenerates growing slower than proximal regenerates (Lee et al., 2005). (C) Adult females treated with vehicle or Eth for 14 days prior to one day of washout had specific defects in anterior regeneration that mirrored male defects. n = 16. Data are mean ± s.d.; *P < 0.001 by one-way ANOVA with Bonferroni’s posttest. |

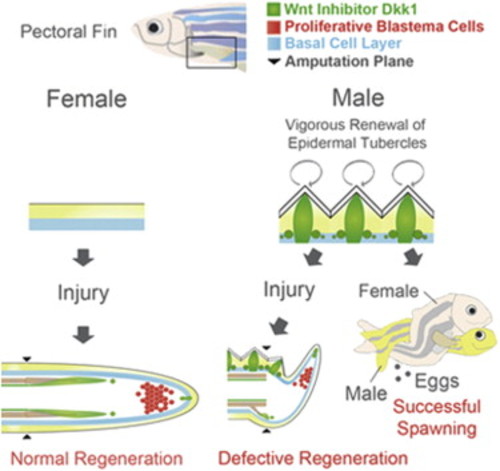
Cartoon Model of Dkk1b Production and Consequences During Zebrafish Fin Regeneration (A) Regeneration in fins other than male pectoral fins. Dkk1b-producing cells are negligible in the regenerate at 2 dpa prior to regenerative outgrowth (left), but appear adjacent to less proliferative mesenchymal regions by 4 dpa (right). Because Dkk1b has inhibitory effects on blastemal proliferation and fin regeneration, its presence in one or both of these areas is likely to represent an inhibitory component of the regeneration niche. (B) Regeneration in male pectoral fins. Male pectoral fin ET constitutively produce Dkk1b, positioning this inhibitor in the site of regeneration at 2 dpa (left). By 4 dpa (right), interference by ET-generated Dkk1b inhibits blastema formation, directing initial growth ventrally and potentially mispatterning the regenerate. |
Reprinted from Developmental Cell, 27(1), Kang, J., Nachtrab, G., and Poss, K.D., Local dkk1 crosstalk from breeding ornaments impedes regeneration of injured male zebrafish fins, 19-31, Copyright (2013) with permission from Elsevier. Full text @ Dev. Cell