
- Title
-
The parallel growth of motoneuron axons with the dorsal aorta depends on Vegfc/Vegfr3 signaling in zebrafish
- Authors
- Kwon, H.B., Fukuhara, S., Asakawa, K., Ando, K., Kashiwada, T., Kawakami, K., Hibi, M., Kwon, Y.G., Kim, K.W., Alitalo, K., and Mochizuki, N.
- Source
- Full text @ Development
Filopodia facilitate anastomosis of DLAV and the vein plexus. (A,B) Endothelial tip cells of untreated (A) and 0.08 μg/ml Lat. B-treated (B) 31 hpf Tg(Fli1ep:Lifeact-EGFP); Tg(Kdr-l:ras-Cherry)s916 zebrafish embryos at the dorsal roof of the neural tube. Arrows indicate polymerisation of F-actin at new cell contacts. Time is in minutes. (C-D′) Vein plexi of Tg(Fli1ep:Lifeact-EGFP); Tg(Kdr-l:ras-Cherry)s916 embryos treated with DMSO or 0.1 μg/ml Lat. B from 31 to 46 hpf. Arrowheads indicate junctional F-actin. DA, dorsal aorta; DV, dorsal vein; VV, ventral vein. Scale bars: 10 μm. EXPRESSION / LABELING:
|
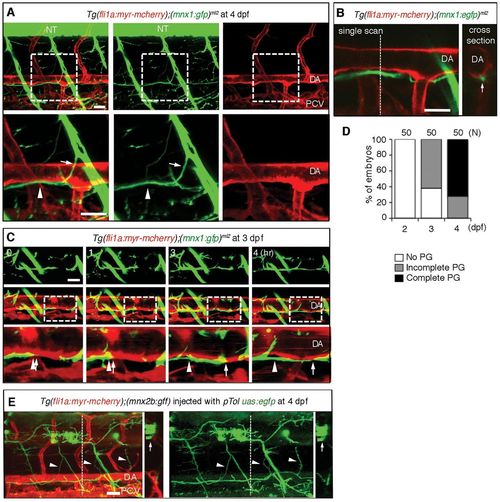
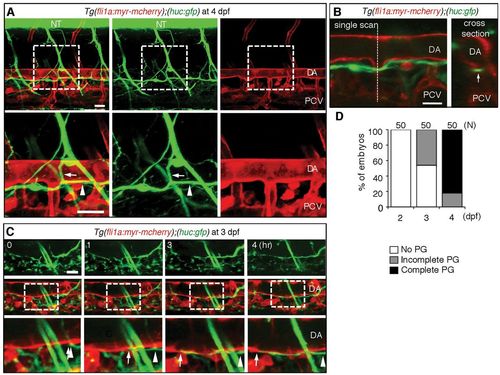
Axons of motoneurons develop beneath the dorsal aorta. (A) 3D-rendered confocal stack of fluorescence images (lateral view) of an Tg(fli1a;myr-mcherry);(mnx1:gfp)ml2 embryo at 4 dpf. Left column, merged images; center column, GFP images; right column, mCherry images. Lower panels are enlarged images of the boxed regions in the upper panels. Anterior is to the left. Arrows indicate the branch of the descending axon of motoneurons. Arrowheads indicate the extension of axons beneath the DA. (B) Left, a single scan confocal image from the stack shown in A. Right, a cross-section image of the stacked image shown in A at the level of the dashed line in the left panel. Arrow denotes the single fascicle of axons. (C) 3D-rendered confocal time-sequential stack images of an Tg (fli1a:myr-mcherry);(mnx1:gfp)ml2 embryo. Elapsed time (hours) from the start point of time-lapse imaging (3 dpf) is indicated. Top panels, GFP images; middle panels, merged images of GFP and mCherry; bottom panels, enlarged images of boxed regions of the middle panels. Arrows indicate the tip of a neuronal axon. Arrowheads denote the location of the tip when starting time-lapse imaging. (D) Parallel growth (PG) of motoneuron axons with the DA was quantitatively analyzed. ‘Complete’ indicates the complete continuity of the axon between the region above the rostral part of the yolk tube and that above the caudal part of the yolk tube. The number of embryos observed is indicated at the top. (E) Single-cell labeling experiment of an embryo of the indicated genotype. Left, 3D-rendered confocal merged image of mCherry and EGFP with a cross-section image at the level of the dashed line. Right, EGFP image with a cross-section image of the EGFP image at the level of the dashed line. Arrows and arrowheads denote the cell bodies of motoneurons in the neural tube and their axons extending beneath the DA, respectively. Scale bars: 25 μm. DA, dorsal aorta; NT, neural tube; PCV, posterior cardinal vein. EXPRESSION / LABELING:
|
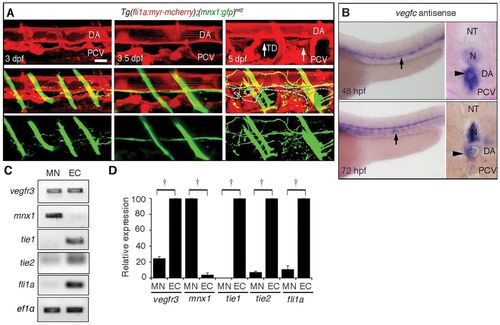
Motoneurons express Vegfr3. (A) 3D-rendered confocal stack of fluorescence images (lateral view) of a Tg(fli1a:myr-mcherry);(mnx1:gfp)ml2 embryo at the times indicated in the top panels. Top panels, blood vessels and lymphatic vessels marked by mCherry; middle panels, merged images of GFP and mCherry; bottom panels, motoneurons marked by GFP. Arrows indicate the TD. Dashed lines in the middle panel indicate the outline of the TD. Note that the axon extension preceded TD development and that the axons were formed between DA and TD. Scale bar: 25 μm. (B) In situ hybridization analyses of vegfc mRNA in embryos at the indicated stages. Arrows and arrowheads indicate vegfc mRNA detected in the DA in the lateral views (left) and cross-section views (right), respectively. (C) RT-PCR analyses using the primers indicated at the left and RNAs prepared from the Tg(fli1a:myr-mcherry);(mnx1:gfp)ml2 embryos by FACS at 72 hpf. (D) Real-time quantitative RT-PCR analyses using RNAs prepared from embryos at 72 hpf by the primers as indicated at the bottom. †P<0.05. Error bars indicate s.d. DA, dorsal aorta; EC, endothelial cells; MN, motoneurons; N, notochord; NT, neural tube; PCV, posterior cardinal vein; TD, thoracic duct. |
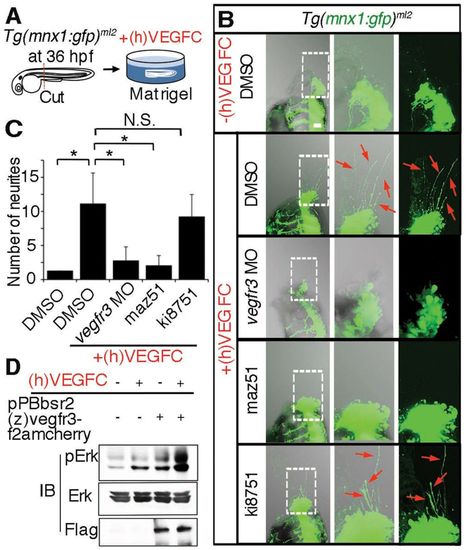
Motoneurons extend neurites in response to recombinant VEGFC. (A) Schematic of an ex vivo assay for examining neurite sprouting from motoneurons. Briefly, the Tg(mnx1:gfp)ml2 embryos were cut at the dorsoventral line between the main yolk and the rostrally extended yolk tube and was embedded in matrigel with or without recombinant human vascular endothelial growth factor-C, (h)VEGFC. (B) z-stack confocal images (left panel, merged image of transmitted light image and GFP image; center, enlarged image of the boxed region in the left panel; right, GFP image of the boxed region in the left panel) of Tg(mnx1:gfp)ml2 embryos incubated in matrigel. Upper panels, embryo in matrigel without (h)VEGFC; lower four panels, embryos in matrigel with (h)VEGFC and treated as indicated at the left. Red arrows indicate GFP-positive neurites from motoneurons. Anterior is at the top and dorsal to the right. (C) Quantitative analyses (ANOVA) of neurite number of the embryos grouped as in B. *P<0.05. Plotted is mean ± s.d. of more than ten embryos for each group. (D) Immunoblot analyses with the antibodies indicated at the left using lysates of parental HEK293 and those stably transfected with pPBbsr2(z)vegfr3-f2amcherry and treated with or without (h)VEGFC. A representative result of three independent experiments is shown. |
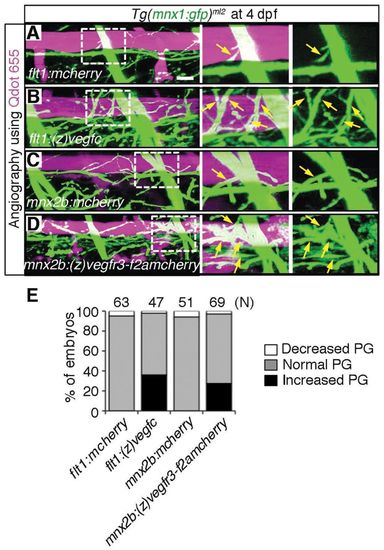
Overexpression of either Vegfc in the dorsal aorta or Vegfr3 in the motoneurons enhances axon branches of motoneurons over the dorsal aorta. (A-D) 3D-rendered confocal stack images (lateral view) of Tg(mnx1:gfp)ml2 embryos transiently expressing the molecules indicated at the bottom left of the left-hand panels. The embryos were intravascularly injected with Qdot 655. Left panels, merged images of GFP and Qdot 655 images; center panels, enlarged image of boxed region of the left panels; right panels, enlarged image of boxed region of the left panels showing GFP signal only. (A) Tg(mnx1:gfp)ml2 embryo transiently expressing mCherry in arteries under the control of the flt1 promoter by Tol2-mediated gene transfer. Scale bar: 25 μm. (B) Zebrafish expressing (z)Vegfc similar to A. (C) Embryo transiently expressing mCherry in motoneurons under the control of the mnx2b promoter by Tol2-mediated gene transfer. (D) Embryo transiently expressing zebrafish (z)Vegfr3 tagged with Flag (F) followed by 2A peptide and mCherry [(z)Vegfr3-F2AmCherry] similar to C. Arrows indicate branches of motoneurons. (E) Quantitative analyses of branching of axons over the DA. The number of the embryos showing the increased, normal or decreased parallel growth (PG) divided by the total number (n) of embryos counted (indicated at the top) is expressed as percentage of embryos. |
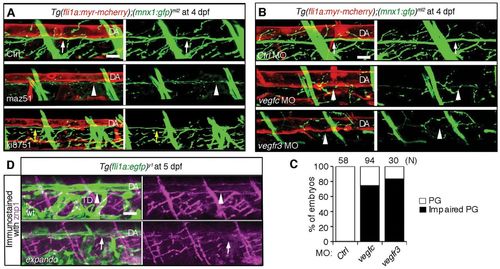
Requirement of Vegfc and Vegfr3 for alignment of motoneuron axons and dorsal aorta. (A) 3D-rendered confocal stack images (lateral view) of Tg(fli1a:myr-mcherry);(mnx1:gfp)ml2 embryos treated with control DMSO (Ctrl, upper panels), with maz51 (middle panels) or with ki8751 (lower panels) at 4 dpf. Left panels, merged images of mCherry and GFP; right panels, GFP images. White arrows indicate the motoneurons beneath the DA. Arrowheads indicate the reduced growth of motoneuron axons beneath the DA. Yellow arrows indicate the slight reduction of growth of motoneuron axon beneath the DA. (B) 3D-rendered confocal stack images (lateral view) of Tg(fli1a:myr-mcherry);(mnx1:gfp)ml2 embryos treated with control MO (Ctrl, top panels), with vegfc MO (middle panels) or with vegfr3 MO (bottom panels). Left panels, merged images of mCherry and GFP; right panels, GFP images. Arrows indicate the motoneuron axons beneath the DA. Arrowheads indicate the reduced interaction of motoneurons and dorsal aorta. (C) Quantitative analyses of impairment of parallel growth (PG) of the embryos grouped as in B. The number (n) of the embryos examined for quantitative analyses is indicated at the top. (D) Immunohistochemical study of Tg(fli1a:egfp)y1 embryos (top) and vegfr3hu4602/wt(expando mutant);Tg(fli1a:egfp)y1 embryos using anti-znp1 antibody. Arrowheads and arrows indicate the presence or absence of axons beneath the dorsal aorta, respectively. Note that the TD is absent in the expando mutant. Scale bar: 25 μm. DA, dorsal aorta; TD, thoracic duct. |
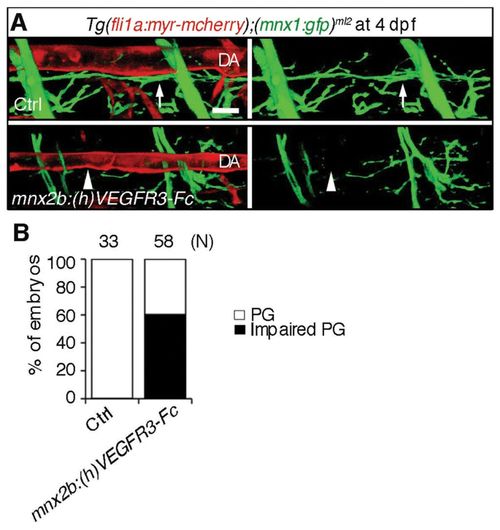
Inhibition of Vegfr3 in the motoneuron results in impairment of alignment of the motoneuron axons and dorsal aorta. (A) 3D-rendered confocal stack images (lateral view) of Tg(fli1a:myr-mcherry);(mnx1:gfp)ml2 embryos (upper panel) and those transiently expressing (h)VEGFR3-Fc in the motoneurons under the control of the mnx2b promoter by Tol2-mediated gene transfer (lower panels). Left panels, merged images of mCherry and GFP; right panels, GFP images. Arrows indicate the motoneuron axon beneath the dorsal aorta (DA). Arrowheads indicate the impairment of parallel growth of motoneuron axon with the DA. Scale bar: 25 μm. (B) Quantitative analyses of the impaired parallel growth (PG) of the embryos grouped as in A. The number (n) of the embryos observed indicated at the top. |
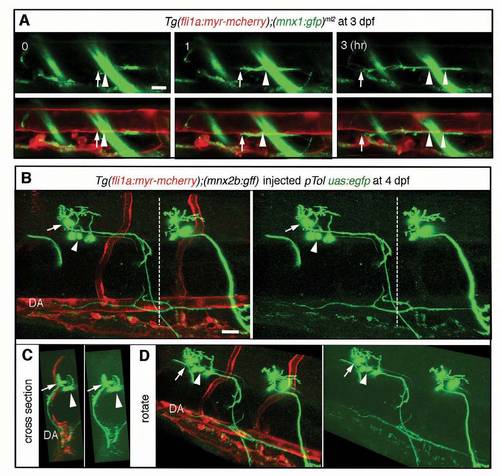
Motoneurons extend axons rostrally and caudally along the dorsal aorta. (A) Time-sequential confocal section images (lateral view) of an embryo expressing Tg(fli1a:myr mcherry);(mnx1:gfp)ml2. Elapsed time (hours) from the start point of time-lapse imaging (3 dpf) is shown in the upper panels. Upper panels, GFP images; lower panels, merged images of GFP and mCherry. Arrows indicate the tip of extending neuronal axon. Arrowheads denote the location of the tip when starting timelapse imaging. Note that axons grow rostrally along the dorsal aorta (DA). (B,C) 3D volume-rendered confocal stack images of the embryo indicated at the top in which a single cell was labeled. Left, the merged image of mCherry and GFP. Right, GFP image. Arrows and arrowheads indicate the different motoneuronal cell bodies. The 3D volume-rendered confocal stack images anterior to the dashed lines in B are shown in C. (D) Oblique views of B. Scale bars: 25 μm. |
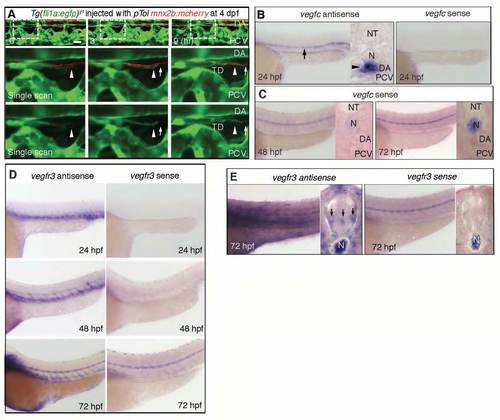
Development of the thoracic duct along the axons of motoneurons. (A) Time-sequential confocal images (lateral view) of a Tg(fli1a:egfp)y1 embryo injected with pTol mnx2b:mcherry plasmid and transposase mRNA for Tol2 transposon-mediated gene transfer. Elapsed time (hours) from the start point (4 dpf) of time-lapse imaging is shown in the top panels. Top panels, merged images of GFP and mCherry; middle panels, enlarged single scan images of boxed regions in top panels; bottom panels, enlarged single scan images of GFP images of boxed regions in the same column. Arrows indicate the tip of developing thoracic duct. Arrowheads denote the location of the tip when starting time-lapse imaging. Scale bar: 25 mm. (B,C) Expression analyses of vegfc mRNA by in situ hybridization at 24 hpf (B) and negative control of those at 48 and 72 hpf (C). Cross-sectioned images are on the right side of each panel. Arrow and arrowhead indicate the expression of vegfc in the DA. (D) Expression analyses of vegfr3 mRNA by in situ hybridization at 24 hpf (top), 48 hpf (middle) and 72 hpf (bottom). (E) The result of longer reaction of detection of (D, bottom) with the transverse section images. Arrows denote the expression of vegfr3 in neural tube. DA, dorsal aorta; N, notochord; NT, neural tube; PCV, posterior cardinal vein. |
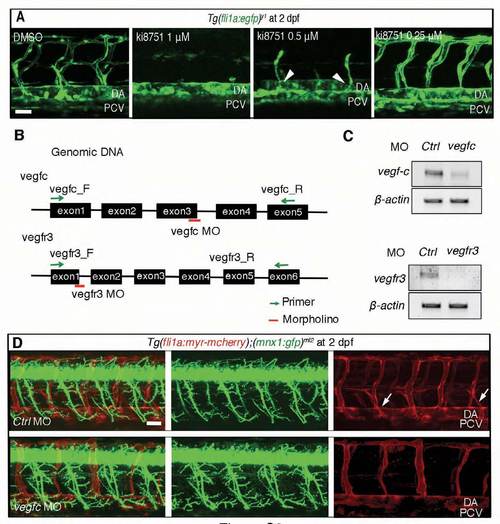
Schematic illustration of the vegfc and vegfr3 genes and the primer sets for verifying the expression of vegfc and vegfr3 mRNAs. (A) 3D-rendered confocal stack images (lateral view) of a Tg (fli1a:egfp)y1 embryo treated with DMSO (control) and ki8751 (1 μM, 0.5 μM and 0.25 μM) at 2 dpf. Arrowheads indicate the secondary sprouting from the PCV. (B) vegfc and vegfr3 genes with the primers for examining the expression of vegfc and vegfr3 mRNAs and with the morpholinos (MOs) blocking splicing. (C) RT-PCR analyses using the primers indicated at the left and RNAs prepared from the embryos injected with control (Ctrl) MO or target MOs as indicated at the top. (D) 3D-rendered confocal stack of fluorescence images (lateral view) of Tg(fli1a:myr-mcherry);(mnx:gfp)ml2 embryos treated with either control MO (Ctrl, top panels) or vegfc MO (bottom panels) at 2 dpf. Left column, merged images; center column, GFP images; right column, mCherry images. Arrows indicate the secondary sprouts from the PCV. Anterior is to the left. DA, dorsal aorta; PCV, posterior cardinal vein. Scale bars: 25 μm. |
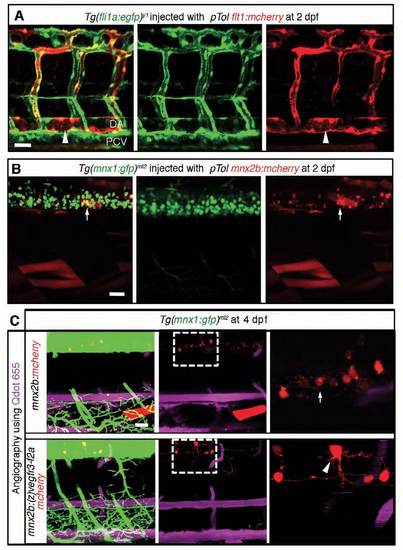
Tissue-specific expression of genes driven by the flt1 and the mnx2b promoter used for Tol2-mediated gene transfer. (A,B) 3D-rendered confocal stack of fluorescence images (lateral view) of a Tg(fli1a:egfp)y1 embryo (2 dpf) injected with pTol flt1:mcherry plasmid (A) and of a Tg(mnx1:gfp)ml2 embryo (2 dpf) injected with pTol mnx2b:mcherry plasmid (B). Arrowheads indicate the expression of mCherry in the DA (A). Arrows indicate the expression of mCherry in motoneurons (B). DA, dorsal aorta; PCV, posterior cardinal vein. Note that mCherry is observed in the DA and arterial intersegmental vessels but not in the PCV in A. (C) 3D-rendered confocal stack images (lateral view) of Tg(mnx1:gfp)ml2 embryos transiently expressing the molecules indicated at the left. The embryos were injected with Quantum (Q) dot 655 into the blood vessels at 4 dpf. Left panels, merged images of GFP, mCherry and Qdot 655 images; center panels, merged images of mCherry and Qdot 655 images; right panels, enlarged image of boxed region of the center panels. Arrow and arrowhead indicate expression of mCherry in the motoneurons. Scale bars: 25 μm. |
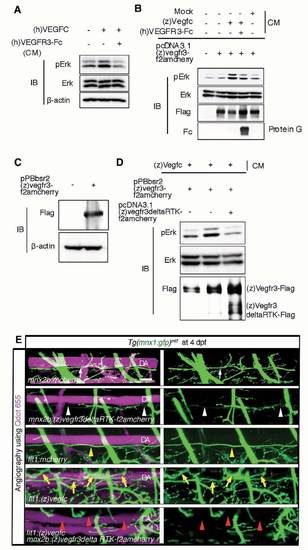
Impaired parallel growth of motoneurons after inhibition of vegfr3 in motoneurons. (A) Immunoblot analyses with the antibodies indicated at the left using cell lysates of HUVECs treated with recombinant human (h)VEGFC together with or without a truncated mutant of (h)VEGFR3 tagged with human IgG Fc, (h)VEGFR3-Fc, prepared from the conditioned medium (CM) of 293T cells transfected with the plasmids expressing (h)VEGFR3-Fc. (B) Immunoblot analyses with the antibodies indicated at the left using cell lysates of 293T cells transfected with or without the plasmid expressing zebrafish (z)Vegfr3 tagged with Flag followed by 2A peptide and mCherry (pcDNA3.1(z)vegfr3-f2amcherry) and treated with the CM indicated at the top. Bottom panel, precipitates on protein G and subjected to immunoblot with anti-human immunoglobulin. (C) Immunoblot analyses with the antibodies indicated at the left using the cell lysates of the parental and HEK293 cells stably transfected with pPBbsr2(z)vegfr3-f2amcherry plasmids using piggyBac transposon system. (D) Immunoblot analyses with the antibodies indicated at the left using the lysates of the cells described in C transfected with the plasmid expressing zebrafish (z)Vegfr3 lacking the cytoplasmic domain tagged with Flag followed by 2A peptide and mCherry (pcDNA3.1(z)vegfr3deltaRTKf2amcherry) and treated with the conditioned medium (CM) as indicated at the top. (E) 3D-rendered confocal stack images (lateral view) of Tg(mnx1:gfp)ml2 embryos injected with the plasmids indicated at the bottom of each panel at 4 dpf. Blood vessels were visualized by injecting Quantum (Q) dot 655 into the blood vessels. Left panels, merged images of GFP and Qdot 655 images; right panels, GFP images. White arrows and yellow arrowheads indicate parallel growth (PG) of motoneuron axons beneath the DA. White arrowheads and red arrowheads denote the impairment of PG of motoneuron axons and DA. Yellow arrows indicate the increased branches of motoneuron axons. Scale bar: 25 μm. DA, dorsal aorta. |