
- Title
-
Hemogenic endothelium specification and hematopoietic stem cell maintenance employ distinct Scl isoforms
- Authors
- Zhen, F., Lan, Y., Yan, B., Zhang, W., and Wen, Z.
- Source
- Full text @ Development
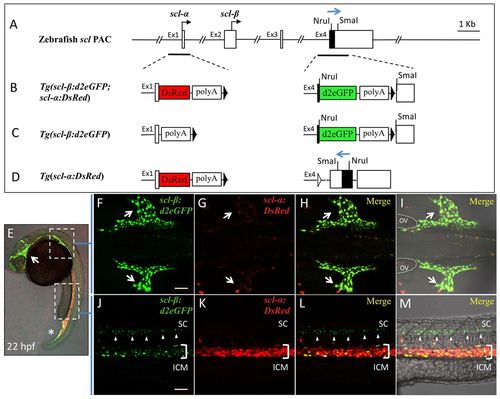
Generation of scl transgenic lines and expression of d2eGFP and DsRed coincides with that of the endogenous scl-β and scl-α isoforms. (A) The structure of the zebrafish scl locus in the PAC clone BUSM-129I22. The transcription start sites of scl-α and scl-β are indicated (black arrows). The black box in exon 4 represents sequences encoding the basic helix-loop-helix (bHLH) domain. (B-D) The modified scl PAC used to generate Tg(scl-β:d2eGFP; scl-α:DsRed), Tg(scl-β:d2eGFP) and Tg(scl-α:DsRed). DsRed, an SV40 polyadenylation signal and a remaining FRT site were inserted behind exon 1 (B,D). d2eGFP, an SV40 polyadenylation signal and a remaining FRT site were inserted in exon 4 (B,C). The transcription activity of scl-α was interrupted by an SV40 polyadenylation signal immediately after exon 1 (C), whereas Scl-β expression was disrupted by the reversal of the protein coding sequences in exon 4 (D, blue arrow). (E-M) Expression of fluorescent reporter proteins in a 22 hpf Tg(scl-β:d2eGFP; scl-α:DsRed) embryo. Scl-β:d2eGFP is largely expressed in the head vasculature (E, arrow), the developing common cardinal vein (CCV) (F-I, arrows) and posterior part of the posterior blood island (PBI) (E, asterisk). By contrast, scl-α:DsRed is restricted in the intermediate cell mass (ICM) (J-M, bracket). (F-I) Higher magnification of d2eGFP and DsRed expression in the anterior lateral plate mesoderm region. D2eGFP is highly expressed in endothelial cells of the CCV across the yolk sac (arrows), whereas DsRed is almost undetected. (J-M) Higher magnification of d2eGFP and DsRed expression in the ICM region. DsRed is largely expressed in erythrocytes of the ICM, whereas d2eGFP is less expressed in ICM but dominant in neurons of the whole trunk segment of the spinal cord (arrowheads). The embryos are shown in lateral (E,J-M) or dorsal (F-I) views, with anterior to the left. ov, otic vesicle; sc, spinal cord. Scale bars: 50 μm. EXPRESSION / LABELING:
|
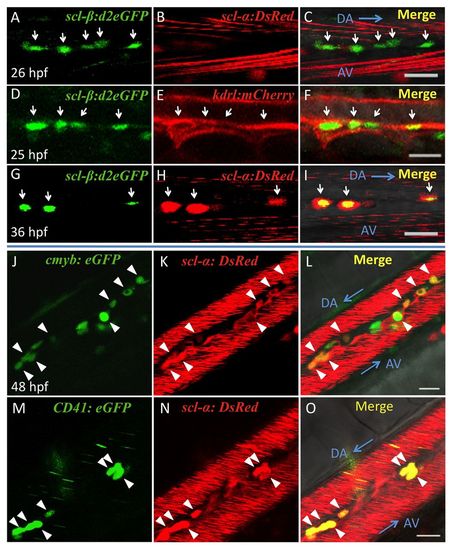
Expression of scl-β and of scl-α in the AGM represent two sequential cell populations. (A-C) Expression of fluorescent proteins in the AGM of a 26 hpf Tg(scl-β:d2eGFP; scl-α:DsRed) zebrafish embryo. The scl-β:d2eGFP signals were detected lining the ventral side of the dorsal aorta, whereas expression of scl-α:DsRed was absent. (D-F) Expression of fluorescent proteins in the AGM of a 25 hpf Tg(scl-β:d2eGFP; kdrl:Ras-mCherry) embryo. scl-β:d2eGFP was co-expressed with kdrl:Ras-mCherry in endothelial cells. (G-I) Expression of fluorescent proteins in the AGM of a 36 hpf Tg(scl-β:d2eGFP; scl-α:DsRed) embryo. The scl-β:d2eGFP and scl-α:DsRed signals overlapped in the forming HSCs. Arrows in A-I indicate the cells in the AGM that express the corresponding fluorescent proteins. (J-O) cmyb or CD41 (itga2b) is co-expressed with scl-α in AGM HSCs (arrowheads) of 48 hpf live Tg(cmyb:eGFP; scl-α:DsRed) embryos or 56 hpf live Tg(CD41:eGFP; scl-α:DsRed) embryos. Blue arrows indicate the direction of circulation. The red stripes in vessels are due to the rapid confocal scanning of circulating scl-α:DsRed+ red blood cells. DA, dorsal aorta; AV, axial vein. Scale bars: 20 μm. |
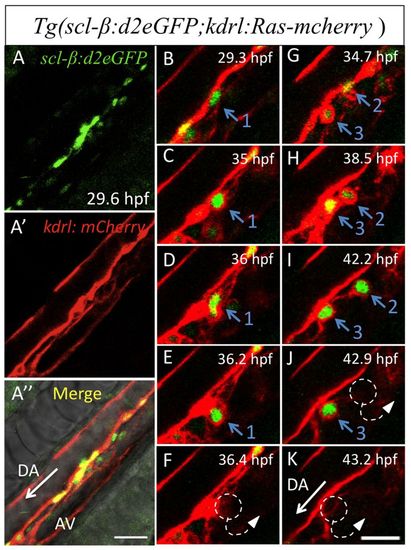
Expression of scl-β labels hemogenic endothelium that undergoes EHT. Time-lapse confocal imaging of a live Tg(scl-β:d2eGFP; kdrl:Ras-mcherry) zebrafish embryo from 30 to 43 hpf. (A-A′) Global views of the trunk region at 30 hpf. (B-K) Three VAE cells expressing scl-β:d2eGFP are seen to undergo EHT and subsequently enter circulation through the axial vein. Also see supplementary material Movie 2. Dashed circles and arrows (F,J,K) indicate HSCs that disappear from the AGM and enter into circulation. White arrows (A′,K) indicate the direction of the blood stream in the dorsal aorta. Scale bars: 30 μm in A-A′ 20 μm in B-K. |
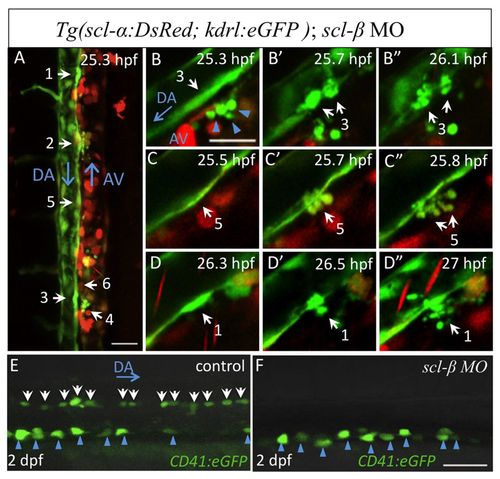
scl-β is crucial for hemogenic endothelium specification. (A-D′) Time-lapse confocal imaging of a live Tg(scl-α:DsRed; kdrl:eGFP) scl-β zebrafish morphant from 25 to 36 hpf. White arrows and numbers indicate the endothelial cells that will undergo fragmentation during the following 6 hours. In B-D′, three kdrl:eGFP+ elongated endothelial cells burst into fragments without initiation of budding. Also see supplementary material Movie 3. Blue arrowheads in B indicate some cell debris that already existed before recording. Similar results were obtained in all three scl-β morphants observed (n=3/3). (E,F) CD41:eGFP+ HSCs in the AGM region of 2 dpf live control embryos and scl-β morphants. On average, fewer than one CD41:eGFP+ HSC could be detected in the AGM of scl-β morphants (n=17/19), compared with an average of 13 CD41:eGFP+ HSCs (white arrows) in the same region of control embryos. Blue arrowheads identify pronephric duct cells. Scale bars: 30 μm in A; 20 μm in B-F. |

Expression of scl-α:DsRed correlates with EHT. (A-D′) Time-lapse confocal imaging of a live Tg(scl-α:DsRed; kdrl:eGFP) zebrafish embryo from 34 to 37 hpf. Selected planes are presented to show EHT of an scl-α:DsRed+/kdrl:eGFP+ cell (blue arrows). An scl-α:DsRed+/kdrl:eGFP+ cell in the AGM before recording (A-A′, blue arrowheads) enters circulation shortly after (B-B′, dashed circles and arrows). White arrow (D′) indicates the direction of blood flow in the dorsal aorta. Scale bar: 20 μm. |

scl-a7alpha; is required for the maintenance of HSCs in the AGM. (A-F) cmyb expression in control zebrafish embryos and scl-α morphants. Arrows indicate cmyb expression in AGM (A,B,D,E) or CHT (C,F) region. D, n=43/48; E, n=37/45; F, n=34/40. (G,H) CD41:eGFP+ HSCs in the AGM of 2 dpf control embryos and scl-7alpha; morphants (n=25/28). White arrows identify the CD41:eGFP+ HSCs and blue arrowheads indicate unaffected CD41:eGFP+ cells in the pronephric duct. (I-L2) Time-lapse confocal imaging of a live Tg(scl-α:DsRed; kdrl:eGFP) embryo injected with scl-α MO from <38 to 50 hpf. In J-L′, selected planes show three apoptotic HSCs in the scl-α morphants. Also see supplementary material Movie 4. Similar results were obtained in all four scl-α morphants observed (n=4/4). Scale bars: 50 μm in G,H; 20 μm in I-L2. EXPRESSION / LABELING:
PHENOTYPE:
|
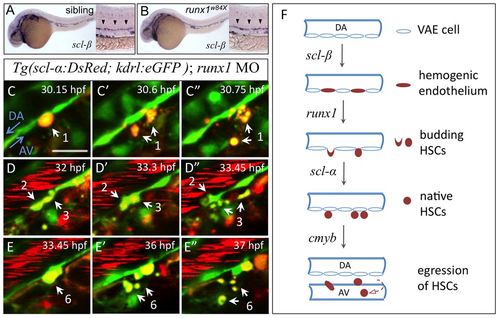
Scl-β, Runx1 and Scl-α regulate sequential steps of AGM HSC development. (A,B) Hemogenic endothelium marked by scl-β expression in 28 hpf siblings (heterozygotes and wild type) and runx1w84x mutant zebrafish embryos. Arrowheads indicate expression of scl-β in the AGM region. (C-E′) Time-lapse confocal imaging of a live Tg(scl-α:DsRed; kdrl:eGFP) embryo injected with runx1 MO from 32 to 39 hpf. White arrows indicate four scl-α:DsRed+ VAE cells that initiate budding but then fragment. Also see supplementary material Movie 5. Similar results were obtained in all three of the runx1 morphants examined and a total of 13 such events were observed (n=3/3). Scale bars: 20 μm. (F) A model of the molecular regulation at consecutive steps during the development of HSCs in the AGM. The establishment of hemogenic endothelium relies on scl-β. runx1 is crucial for their subsequent transformation into HSCs via EHT. The maintenance of nascent HSCs in the AGM requires scl-α, and cmyb is essential to regulate the egression of these HSCs from the AGM. |
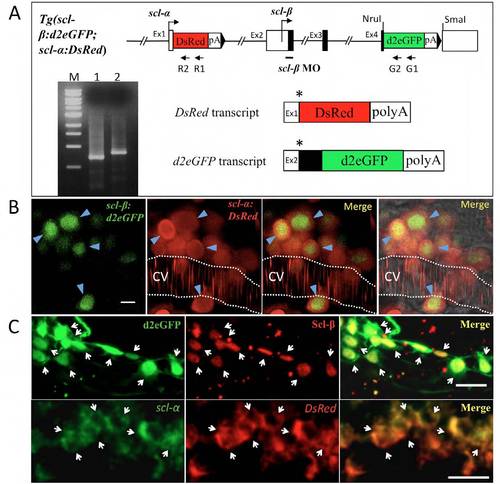
The transcription and expression of d2eGFP and DsRed recapitulate that of endogenous scl-β and scl-α. (A) 5′- RACE experiment to determine the transcription start sites of DsRed and d2eGFP. The position of respective 5′-RACE primer set is indicated (arrows; R1 and R2 for DsRed; G1 and G2 for d2eGFP). Line 1 and line 2 show the 5′-RACE PCR products of DsRed and d2eGFP. M, 1 kb DNA ladder. The sequence result of 59-RACE PCR products indicates that the DsRed transcript starts from the scl-α transcription initiation site and contains the non-coding exon 1, DsRed and SV40 poly(A) sequence; the d2eGFP transcript starts form the scl-&beta initiation site and contains the non-coding sequences of exon 2, Scl-β coding sequences of exon 2, 3 and part of exon 4 (black box), followed by the d2eGFP and SV40 poly(A) sequence. The asterisks indicate the translation initiation site of DsRed and d2eGFP, respectively. The d2eGFP protein is translated as a chimeric protein fused with the N-terminal 75 amino acids of Scl-β. (B) The expression of d2eGFP and DsRed in hematopoietic stem and progenitor cells in the caudal hematopoietic tissue (CHT) of 3 dpf Tg(scl- β:d2eGFP; scl-α:DsRed) larvae. D2eGFP is observed with nucleus restriction. Scale bar: 5 μm. CV, caudal vein. (C) Upper panel shows the double immunohistochemistry staining of d2eGFP and Scl-β (detected by Ab-Scl-C) in the anterior lateral plate mesoderm, where only Scl-β is expressed. Lower panel shows the double whole-mount in situ hybridization (WISH) of DsRed and scl-α (detected by scl-5′ probe) in the ICM of 22 hpf Tg(scl-β:d2eGFP;scl-α:DsRed) embryos. Arrows indicate the colocalized cells. Embryos are shown in lateral views with anterior to the left. Scale bars: 20 μm. |
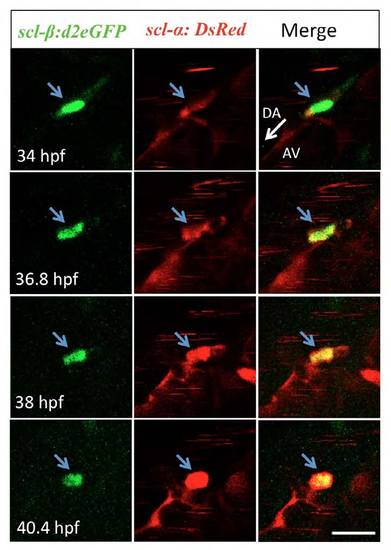
scl-β:d2eGFP+ endothelial cells give rise to scl-β:d2eGFP+/scl-α:DsRed+ HSCs. Time-lapse confocal imaging of a live Tg(scl-β:d2eGFP; scl-α:DsRed) embryo between 34 and 40 hpf. Four selected time points show the stepwise transition of an scl- β:d2eGFP+ endothelial cell to an scl-β:d2eGFP+/scl-α:DsRed+ HSC via EHT (blue arrows). The intensity of DsRed signal is increased as the cell bends outwards. For each time point, d2eGFP, DsRed and merged images are presented. White arrow indicates the direction of circulation in DA. DA, dorsal aorta; AV, axial vein. Scale bar: 20 μm. |
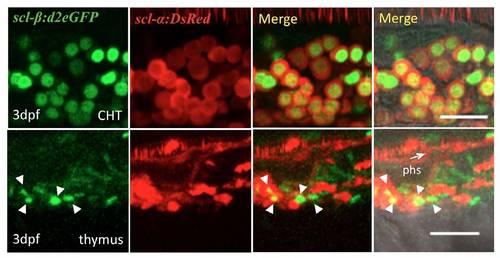
scl-β:d2eGFP+/scl-α:DsRed+ HSCs in definitive hematopoietic tissues. Expression of scl-β:d2eGFP and scl-α:DsRed in definitive hematopoietic organs, CHT and thymus, in live Tg(scl-β:d2eGFP; scl-α:DsRed) larvae at 3 dpf. White arrowheads indicate the cells with co-expression of scl-β:d2eGFP and scl-α:DsRed in the thymus. White arrow indicates the direction of blood stream in phs. Lateral views with anterior to the left. DA, dorsal aorta; AV, axial vein; phs, primary head sinus. Scale bars: 30 μm. EXPRESSION / LABELING:
|
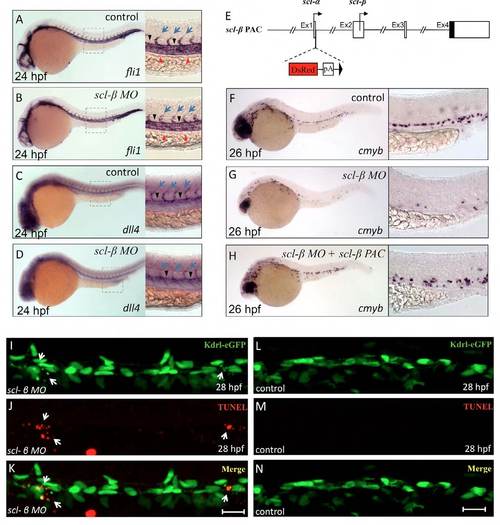
scl-β MO is specific to the loss of hemogenic endothelium in scl-β morphants. (A-D) WISH of the endothelial cell-specific marker fli1 (A,B) and artery-specific marker dll4 (C,D) show comparable expression in control embryos and scl-β morphants at 24 hpf, indicating that the vascular system has developed normally in scl-β morphants. (E-H) The loss of HSCs is partially rescued in the scl-β morphant receiving scl-β PAC expression. (E) The scl-β PAC. DsRed and an SV40 polyadenylation signal cassette were inserted behind exon 1 to interrupt the transcription of scl-α, whereas the expression of scl-β is not affected. (F-H) WISH of the HSCspecific marker cmyb in the 26 hpf control embryo (F), scl-β morphant (G) and scl-β morphant injected with scl-β PAC (H). A lower magnification (8×) is shown to the left and a higher magnification (20×) of the trunk region to the right. Lateral views with anterior to the left. (I-N) Double immunostaining of Kdrl:eGFP and TUNEL in the AGM of 28 hpf scl-β morphants (I-K) and control embryos (L-N). White arrows indicate two Kdrl:eGFP+ cells undergoing apoptosis in the AGM. Scale bar: 20 μm. |
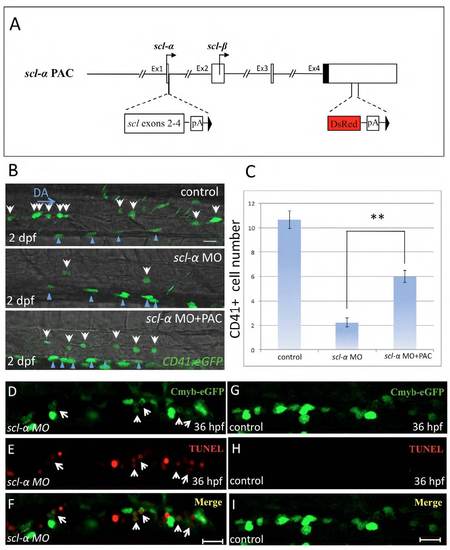
scl-α MO is specific to the defects of HSC maintenance in the AGM of scl-α morphants. (A-C) The loss of HSCs is partially rescued in the scl-α morphant receiving scl-α PAC expression. (A) The scl-α PAC used for rescue. DsRed and an SV40 polyadenylation signal were inserted in exon 4 to interrupt the transcription of scl-β. To introduce normal expression of scl-α, the DNA sequences of scl exon 2, 3, 4 and an SV40 polyadenylation signal were inserted behind exon 1. (B) CD41:eGFP+ HSCs in the AGM region of live 2 dpf control embryos, scl-α morphants and scl-α morphants injected with scl-α PAC. White arrows indicate CD41:eGFP+ HSCs in the AGM. Blue arrowheads identify pronephric duct cells. Scale bar: 20 μm. (C) Statistical analysis showing the number of CD41:eGFP+ HSCs (per five somites) in the AGM of 2 dpf control embryos, scl-α morphants and scl-α morphants injected with scl-α PAC. (D-I) Double immunostaining of Cmyb-eGFP and TUNEL in the AGM of 36 hpf scl-α morphants (D-F) and control embryos (G-I). White arrows indicate three Cmyb:eGFP+ cells undergoing apoptosis in the AGM. Scale bar: 20 μm. |
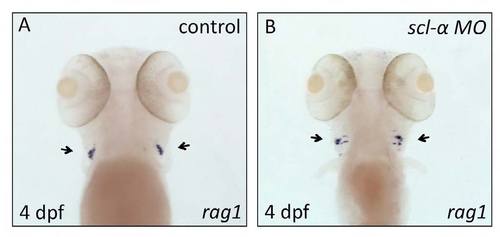
T-cell development is viable in scl-α morphants. WISH of the T lymphocyte-specific marker rag1 (black arrows) in 4 dpf control embryos (A) and scl-α morphants (B) shows that T-cell development is viable in the thymus of scl-α morphants. Dorsal views, anterior up. EXPRESSION / LABELING:
|