
- Title
-
Fibronectin is deposited by injury-activated epicardial cells and is necessary for zebrafish heart regeneration
- Authors
- Wang, J., Karra, R., Dickson, A.L., and Poss, K.D.
- Source
- Full text @ Dev. Biol.
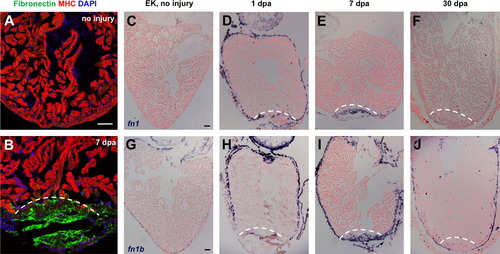
Fibronectin is dynamically expressed during heart regeneration. (A and B) Fibronectin expression by immunostaining in uninjured (A) and 7 dpa (B) ventricles, localizing to the injury site. MHC, Myosin heavy chain. (C–J) In situ hybridization for fn1 and fn1b in uninjured, 1, 7 and 30 dpa ventricles. In each section, violet indicates a positive signal. Dashed line indicates approximate resection plane. Scale bars: 50 μm. |
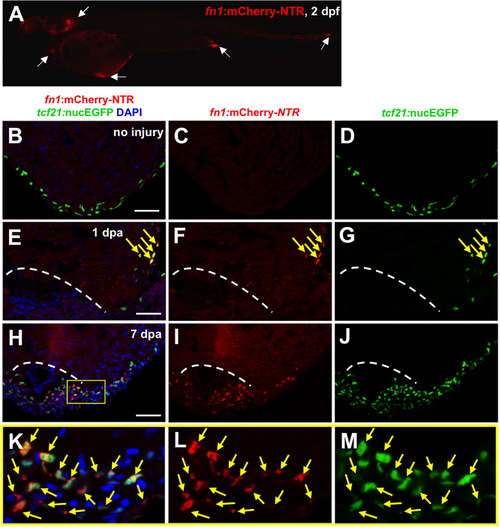
Fibronectin is synthesized predominantly by epicardial cells during heart regeneration. (A) Visualization of fn1:mCherry-NTR-expressing cells at 2 dpf. White arrows show fn1:mCherry-NTR+ cells. (B–M) Visualization of fn1:mCherry-NTR+ cells (red) and epicardial cells (tcf21:nucEGFP+; green) in uninjured, 1 and 7 dpa ventricles. Boxed area indicates an enlarged view. Arrows indicate double-positive cells. Dashed line indicates approximate resection plane. Scale bars: 50 μm. |
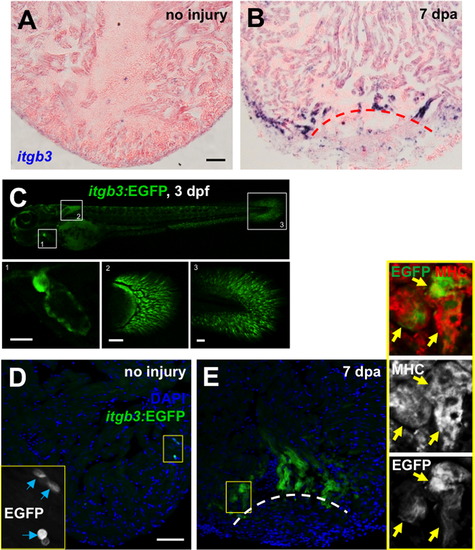
The Fibronectin partner integrin β3 is expressed during heart regeneration. (A and B) itgb3 expression by in situ hybridization in uninjured (A) and 7 dpa (B) ventricles. (C) Visualization of embryonic itgb3:EGFP-expressing cells (green). Boxed areas indicates a higher magnification view of the heart (area 1), pectoral fin (area 2) and posterior fin fold (area 3). (D and E) Visualization of itgb3:EGFP+ cells (green) in uninjured (D) and 7 dpa (E) ventricles. Insets: high magnification of the boxed area. Blue arrows indicate EGFP-positive cells. Yellow arrows indicate EGFP and MHC double-positive cells, indicative of cardiomyocytes. Dashed line indicates approximate resection plane. Scale bars: 50 μm. |
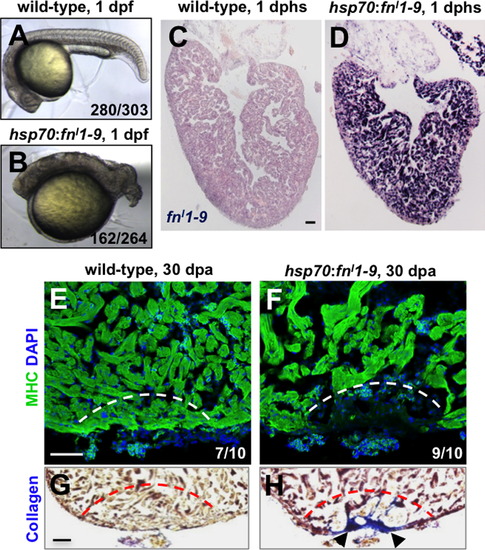
Fibronectin is required for heart regeneration. (A and B) Wild-type embryos (A), or embryos from a cross between hemizygous hsp70:fnI1–9 and wild-type parents (B), were heat-shocked at 6 h post-fertilization (hpf) at 38 °C for 40 min and imaged at 24 hpf. Wild-type embryos appeared largely normal after this treatment (92.4% normal, 7.6% general dysmorphology, n=303). By contrast 61.4% of embryos from the transgenic cross developed a markedly shortened body axis (n=264). (C and D) In situ hybridization for fnI1–9 in wild-type (C) and hsp70:fnI1–9 clutchmate (D) ventricles at 1 day post heat-shock (dphs). (E–H) MHC (Myosin heavy chain; green) staining and collagen staining of hsp70:fnI1–9 (E and G) and wild type clutchmate (F and H) ventricles at 30 dpa. Three of 10 ventricles of heat-shocked clutchmates showed obvious areas of missing myocardium, compared to 9 of 10 ventricles in hsp70:fnI1–9 fish. Fisher Irwin exact test, *p<0.05. Black arrows indicate fibrosis. Dashed line indicates approximate resection plane. Scale bars: 50 μm. |
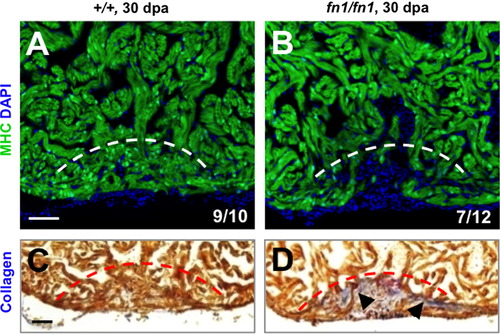
Fibronectin1 mutants show defective heart regeneration. (A–D) Myosin heavy chain (MHC; green) staining (A and B) and collagen staining (C and D) of wild-type and homozygous fn1 mutant ventricles at 30 dpa. One of 10 wild-type and 7 of 12 fn1 mutant ventricles showed obvious areas of depleted myocardium. Dashed line indicates approximate resection plane. Fisher Irwin exact test, *p<0.05. Scale bars: 50 μm. |
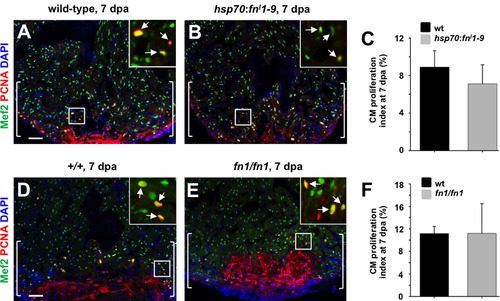
Evidence that Fibronectin does not directly regulate cardiomyocyte proliferation during regeneration. (A and B) Assessment of Mef2+PCNA+ cells (arrows) in hsp70:fnI1–9 (A) and clutchmate (B) 7 dpa ventricles. Insets, enlarged view of the rectangle. Brackets indicate injury site. (C) Quantification of cardiomyocyte proliferation in hsp70:fnI1–9 and clutchmate 7 dpa ventricles. For each group, 6 zebrafish were assessed. Student′s t-test, p=0.23. Mean±s.e.m. (D and E) Assessment of Mef2+PCNA+ cells (arrows) in wild-type (D) and homozygous fn1 mutant (E) 7 dpa ventricles. Brackets indicate injury site. (F) Quantification of cardiomyocyte proliferation in wild-type and homozygous fn1 mutant 7 dpa ventricles. For each group, 3–4 zebrafish were assessed. Student′s t-test, p=0.99. Mean±s.e.m. Scale bars: 50 μm. |
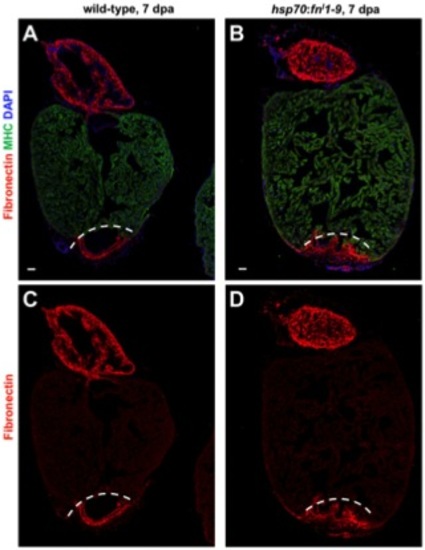
Immunostaining of Fn in wild-type (A, C) and hsp70:fn′1-9 clutchmate (B, D) ventricles at 5 days post heat-shock (dphs) at 7 dpa. Fn (Red) is localized to the injury site in each case. Dashed line indicates approximate resection plane. For each group, 5-6 zebrafish were assessed. Scale bars: 50 μm. |
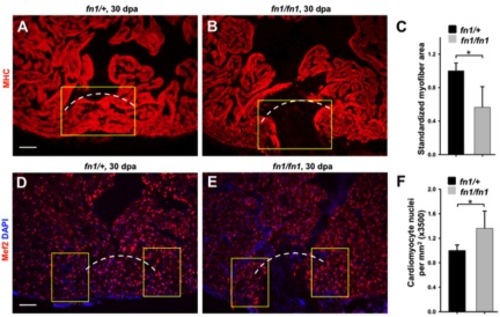
Analysis of heart regeneration in fn1 mutants. (A, B) Myosin heavy chain (MHC; Red) staining of heterozygous (A) and homozygous fn1 mutant (B) ventricles at 30 dpa. (C) Quantification of MHC+ myofiber area from experiments in A and B. Myofiber area was measured by imaging the F59-stained ventricular section containing the largest apparent injury for each animal, quantifying the fluorescence using Openlab and ImageJ software, and calculating the fluorescent pixels within a yellow rectangle (150 μm x 210 μm) used to approximate the regenerated area. Dashed line indicates approximate resection plane. For each group, 5 zebrafish were assessed. Student’s t-test, *p < 0.05. Mean +/- s.e.m. Scale bars: 50 μm. (D, E) Mef2 (Red) staining of heterozygous (D) and homozygous fn1 mutant (E) ventricles at 30 dpa. (F) Quantification of Mef2+ cardiomyocyte nuclear density from experiments in D and E. To quantify Mef2+ cardiomyocytes, we imaged the three ventricular sections with the largest apparent injury per animal, and quantified Mef2+ cells within the yellow rectangles (150 μm x 105 μm) flanking the approximate resection area. Dashed line indicates approximate resection plane. For each group, 5 zebrafish were assessed. Student’s t-test, *p < 0.05. Mean +/- s.e.m. Scale bars: 50 μm. |
Reprinted from Developmental Biology, 382(2), Wang, J., Karra, R., Dickson, A.L., and Poss, K.D., Fibronectin is deposited by injury-activated epicardial cells and is necessary for zebrafish heart regeneration, 427-435, Copyright (2013) with permission from Elsevier. Full text @ Dev. Biol.