
- Title
-
The Role of Aquaporin and Tight Junction Proteins in the Regulation of Water Movement in Larval Zebrafish (Danio rerio)
- Authors
- Kwong, R.W., Kumai, Y., and Perry, S.F.
- Source
- Full text @ PLoS One
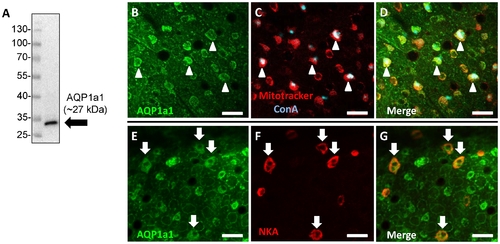
Aquaporin-1a1 is expressed in ionocytes on the skin of yolk sac in larval zebrafish. (A) A representative western blot showing that the eel aquaporin-1a1 (AQP1a1) antibody yielded a single immunoreactive band at ~27 kDa in lysates of 4 dpf zebrafish larvae. (B) Fluorescent immunohistochemistry and confocal microscopy revealed that the expression of AQP1a1 on the skin of yolk sac (green), and a subset of cells stained positively with Mitotracker® (red) and concanavalin-A (conA; blue). (D) is the merged images of B and C. Cells labelled with arrowheads represent areas of colocalization of AQP1a1 and Mitotracker® or conA. (E) Some AQP1a1-positive cells (green) were also colocalized with (F) Na+/K+-ATPase staining (NKA; red). (G) is the merged images of E and F. Cells labelled with arrows represent areas of colocalization of AQP1a1 and NKA. Scale bar = 25 μm. EXPRESSION / LABELING:
|
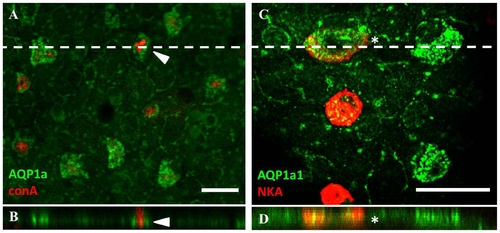
Aquaporin-1a1 is expressed predominantly on the basolateral membrane of ionocytes. Fluorescent immunohistochemistry and z-stack analysis with confocal microscopy revealed that (A and B) the expression of aquaporin-1a1 (AQP1a1; green) does not overlap with concanavalin-A staining (arrow; red). (C and D) However, AQP1a1 expression is found to co-localize with Na+/K+-ATPase (NKA; red) staining (cell labelled with an asterisk). Dashed lines in A and C indicate the position for z-stack images in B and D, respectively. Scale bar = 20 μm. EXPRESSION / LABELING:
|
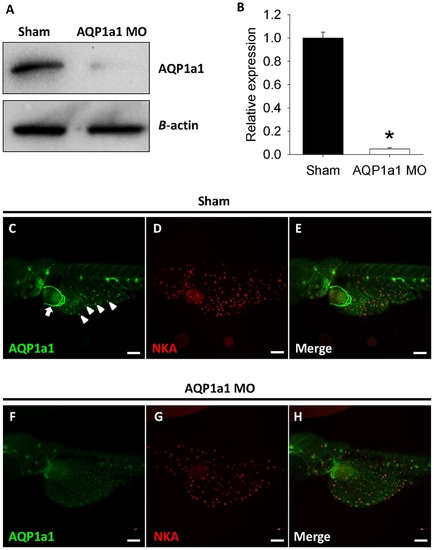
The protein expression of aquaporin-1a1 is reduced by morpholino knockdown. (A) A representative western blot showing the protein expression of aquaporin-1a1 (AQP1a1) in lysates of 4 dpf shams and AQP1a1 morphants (AQP1a1 MO) is reduced following morpholino knockdown. (B) Subsequent quantitative analysis revealed that the protein expression level of AQP1a1 in the morphants was significantly than shams (Student′s t-test; p<0.05). Values are means ± SEM (n = 4). Fluorescent immunohistochemistry and confocal microscopy revealed the expression of (C) AQP1a1 (green; arrowhead) and (D) Na+/K+-ATPase (NKA; red) on the skin of yolk sac in the shams. AQP1a1 was also expressed in the red blood cells (Figure C; arrow). Figure (E) is a merged image of (C) and (D). (F) The expression of AQP1a1 was virtually absent in the morphants following the AQP1a1 knockdown. Figure (G) shows the expression of NKA, and Figure (H) is a merged images of (F) and (G). Scale bar = 50 μm. EXPRESSION / LABELING:
|
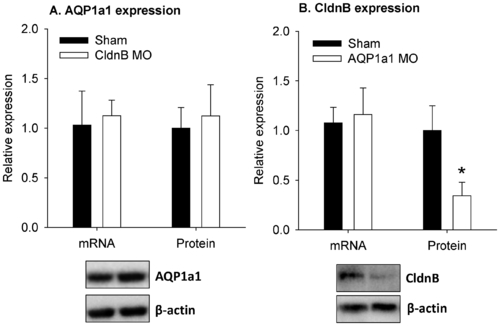
The protein expression of claudin-b is reduced in fish experiencing aquaporin-1a1 knockdown. The mRNA and protein expression levels of (A) aquaporin-1a1 (AQP1a1) and (B) claudin-b (CldnB) in shams and morphants experiencing CldnB or AQP1a1 knockdown. The mRNA and protein levels were determined by real-time PCR and western blot, using 18S and β-actin as the internal control, respectively. The representative western blots for AQP1a1 and CldnB are shown below each respective figure. An asterisk indicates a significant difference in protein level of CldnB between shams and AQP1a1 morphants (Student′s t-test; p<0.05). Values are means ± SEM, n = 5–6. |