
- Title
-
Wnt/Dkk Negative Feedback Regulates Sensory Organ Size in Zebrafish
- Authors
- Wada, H., Ghysen, A., Asakawa, K., Abe, G., Ishitani, T., and Kawakami, K.
- Source
- Full text @ Curr. Biol.
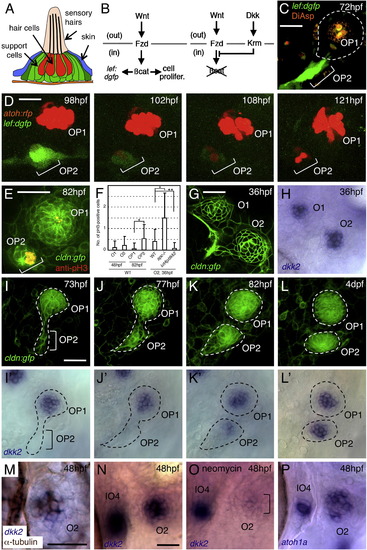
Wnt Signaling and Expression of dkk2 Are Associated with Neuromast Proliferation (A) Schematic drawing of a neuromast in transverse view. (B) Schematic representation of Wnt signaling through its receptor, Frizzled (Fzd), and of its inhibition by Dickkopf (Dkk) signaling through its receptor, Kremen (Krm). out, extracellular compartment; in, intracellular compartment. (C) Wnt signaling is detectable only in budding cells (OP2), but not in mature neuromast (OP1), as revealed in a Wnt-responsive GFP reporter line. (D) The expression of dGFP gradually subsides as hair cells (labeled with atoh:rfp) are formed in O2. (E) Anti-phosphohistone H3 (pH3) labeling indicates dividing cells in budding neuromast (OP2), but not in mature neuromast (OP1). (F) Number of pH3-positive cells per neuromast. Mean ± SEM is indicated. p < 0.001, p < 0.01 (t test). (G and H) dkk2 mRNA is expressed by cells in the center of neuromasts O1 and O2. (I–L2) Expression profile of dkk2 during neuromast budding. dkk2 mRNA expression coincides with neuromast maturation. The budding structures are outlined. (M) dkk2 mRNA (blue) is present in hair cells (brown). (N and O) dkk2 expression is reduced in O2 after ablation of hair cells but is not affected in immature neuromast IO4. (P) atoh1a mRNA is present in O2 and IO4. Scale bars represent 20 μm. See also Figure S1. |
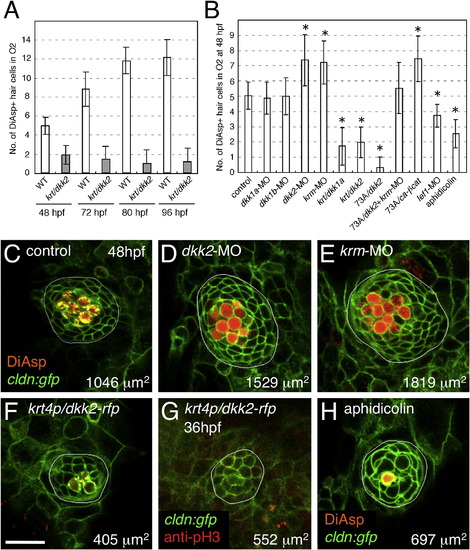
Wnt Signaling Positively Regulates Neuromast Size, Whereas Dkk2/Krm Signaling Negatively Regulates It (A) Neuromast O2 reaches its final size at 80 hpf in wild-type embryos. By contrast, O2 reaches its final size before 48 hpf, and the number of hair cells does not change over time in dkk2-overexpressing embryos. (B) Manipulations of Wnt signaling affect hair cell numbers. Mean ± SEM is indicated. p < 0.001 (t test). (C–E) Knockdown of dkk2 (D) or krm (E) gene function increases neuromast size and hair cell number, as revealed by DiAsp labeling. (F and G) Wnt inhibition by overexpression of dkk2 reduces neuromast size, number of hair cells (F), and number of dividing cells (G). Scale bar represents 20 μm. (H) Pharmacological blockade of cell division phenocopies inhibition of Wnt signaling. See also Figures S1–S3. |
Wnt Signaling Positively Regulates Neuromast Size, Whereas Dkk2/Krm Signaling Negatively Regulates It (A) Neuromast O2 reaches its final size at 80 hpf in wild-type embryos. By contrast, O2 reaches its final size before 48 hpf, and the number of hair cells does not change over time in dkk2-overexpressing embryos. (B) Manipulations of Wnt signaling affect hair cell numbers. Mean ± SEM is indicated. p < 0.001 (t test). (C–E) Knockdown of dkk2 (D) or krm (E) gene function increases neuromast size and hair cell number, as revealed by DiAsp labeling. (F and G) Wnt inhibition by overexpression of dkk2 reduces neuromast size, number of hair cells (F), and number of dividing cells (G). Scale bar represents 20 μm. (H) Pharmacological blockade of cell division phenocopies inhibition of Wnt signaling. See also Figures S1–S3. |
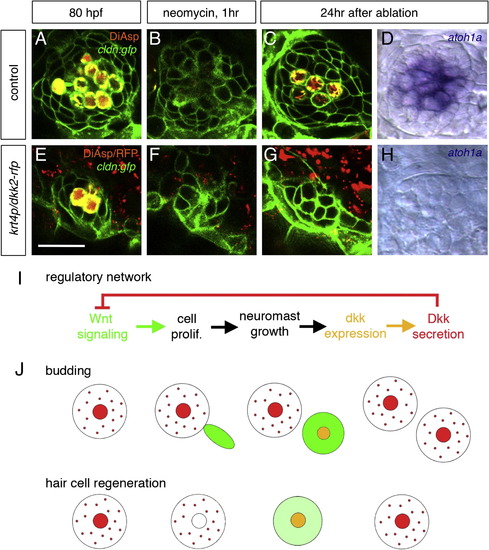
Inhibition of Wnt Signaling Prevents Regeneration of Hair Cells (A–D) Regeneration of hair cells in normal embryos. New hair cells are regenerated within 24 hr after ablation. (E–H) In dkk2-overexpressing embryos, where Wnt signaling is inhibited, new hair cells never form (G and H). Scale bar in (E) represents 20 μm. (I) Proposed mechanism for neuromast size control, based on a regulatory network comprising a negative feedback step. (J) Sequence of events leading to homeostasis in the case of budding of a new neuromast and in the case of hair cell regeneration. Large circles indicate neuromasts; smaller circles indicate hair cells. Wnt signaling (green) is active whenever Dkk (red) is absent. dkk2 mRNA (orange) is expressed in differentiating and mature hair cells. Dkk2 protein (red) secreted by the hair cells reaches the peripheral cells and inhibits Wnt signaling (i.e., cell proliferation). The size of neuromasts is maintained during both budding and regeneration. See also Figure S4. EXPRESSION / LABELING:
PHENOTYPE:
|
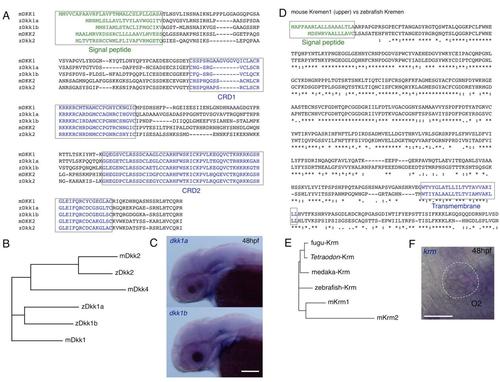
Sequences and Expression of the dkk Family and krm Genes, Related to Figures 1 and 2 (A) Amino acid sequences of mouse and zebrafish Dkk family proteins were compared. Boxes indicate putative signal peptide sequences and the cysteine rich domain (CRD1 and CRD2). |
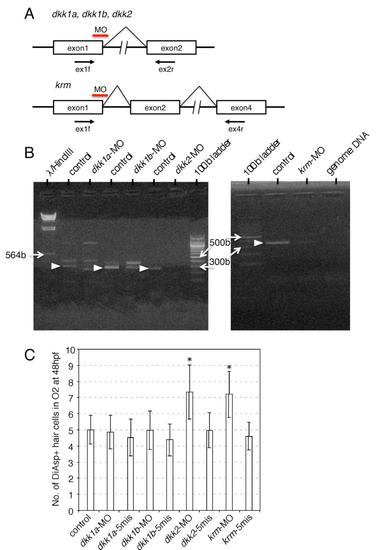
Effect of MOs on Splicing of the Gene Transcripts, Related to Figure 2 (A) MOs were targeted at the first exon - second intron junction to block splicing. In all cases, a premature stop codon which abolishes protein function was predicted from the genomic DNA sequences. RT-PCR analyses were performed to detect the transcripts using the primer sets indicated by arrows. |
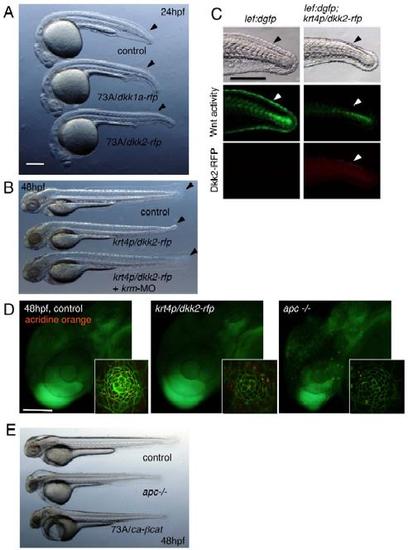
Expression Patterns of the gal4 Driver and UAS Effector Lines, Related to Figures 2 and 3 (A) The enhancer trap SAGFF73A (73A) line strongly expresses gal4 in the whole body. Overexpression of UAS:dkk1a-rfp or UAS:dkk2-rfp by the 73A line resulted in slightly enlarged heads as previously reported in overexpression of dkk1b [S1, S2]. Embryos also failed to form fin fold structures (arrowheads) as reported in embryos in which Wnt downstream signaling was deficient (tcf7 mutant embryos injected with lef1-MO) [S3]. Scale bar represents 100 μm. |
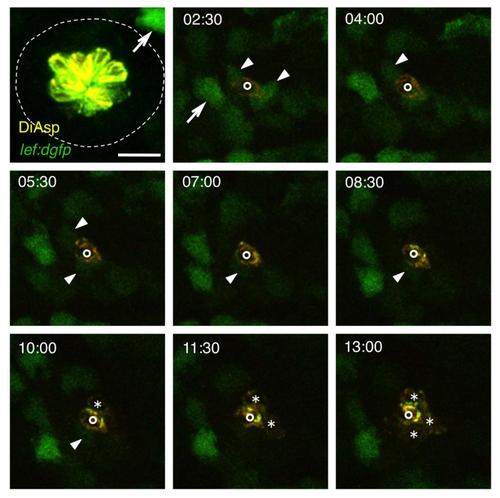
Transient Wnt Activity after Hair Cell Ablation, Related to Figure 4 Neuromast O2 before (52hpf) and after hair cell ablation through neomycin treatment. Frames from a time-lapse sequence are shown; the numbers indicate hours after ablation. Arrows indicate Wnt-active mesenchymal cells lying outside of the neuromast; arrowheads show Wnt-reporter expression in neuromast support cells. Newly formed hair cells are marked by asterisks. The single hair cell already present at 2:30 hours after the ablation (indicated by circles) was presumably beginning to differentiate at the time of the ablation. Scale bar represents 20 μm. |