
- Title
-
Identification of Inter-Organ Vascular Network: Vessels Bridging between Organs
- Authors
- Omae, M., Takada, N., Yamamoto, S., Nakajima, H., and Sato, T.N.
- Source
- Full text @ PLoS One
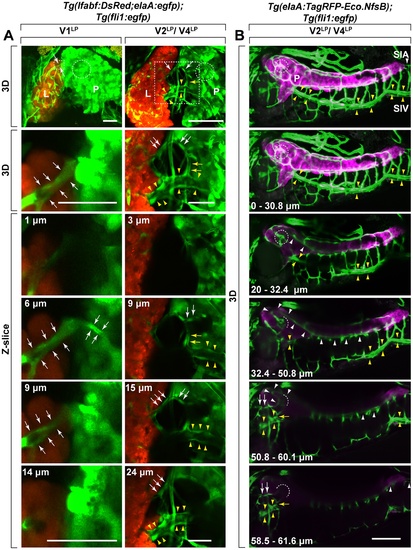
Identification of V1LP, V2LP and V4LP, as inter-organ vessels bridging between liver and pancreas. Three distinct vessels (V1LP, V2LP, V4LP) were found to bridge between liver (L) and pancreas (P). A. The 3D rendered two-photon miscroscopy images (top two panels: 3D) and their serial optical sections (bottom panels: Z-slice) of Tg(lfabf:DsRed;elaA:egfp);Tg(fli1:egfp) at 5 dpf and 6 dpf. The second row 3D panels are the higher magnification of the indicated area (dotted rectangle) in the first row 3D panels. The bottom four panels are Z-slices of the areas shown in second row 3D panels. The depth of each slice is indicated as µm at the top left in each panel of Z-slice. V1LP and V2LP vessels are sandwiched between white arrows and indicated by white arrows, respectively. V4LP vessel is indicated by yellow arrows and supraintestinal veins (SIV) is sandwiched between yellow arrowheads). The islet of Langerhans is indicated (dotted circle in each panel). The islet of Langerhans, consisting of endocrine cells, was identified as an area devoid of EGFP reporter signals driven by the exocrine pancreas-specific elaA promoter (see Fig. 2). In the first column, V1LP vessel (sandwiched white arrows) bridging between liver (L) and pancreas (P) can be clearly seen. Examining the series of Z-slices confirms that V1LP invades into liver tissue. In the second column, V2LP (white arrows) and V4LP (yellow arrows and sandwiched between yellow arrowheads) vessels bridging between liver (L) and pancreas (P) are shown. A connection between V4LP and V2LP appears to exist (yellow arrows in the 2nd panel). Liver (L: orange); endocrine pancreas (P: green); fli1+ vessels (green). Scale bars: 30 μm. B. V2LP (white arrows) and V4LP (yellow arrows and sandwiched between yellow arrowheads) vessels originate from supraintestinal arteries (SIA) and supraintestinal veins (SIV), respectively. The origins of V2LP and V4LP vessels were followed by using Tg(elaA:TagRFP-Eco.NfsB);Tg(fli1:egfp) at 6 dpf. The 3D-rendered Z-stack confocal microscopy images of several Z-slices (depth of ranges is indicated at the bottom left in each panel) are shown in series. Fli1+ vessels and elaA+ exocrine pancreas are shown as green and magenta, respectively. By following the SIA (white arrowheads) in each Z-stack, V2LP is found to originate from vascular plexus at the islet of Langerhans (dotted circle) that is formed by branches of SIA. The 4th and 5th Z-stack panels show that vascular plexus (white arrowheads) at the islet of Langerhans (dotted circle) is formed by branches of SIA. In the 5th Z-slice panel, the direct connection between this SIA-derived vascular plexus at the islet of Langerhans (dotted circle) and V2LP (white arrows) can be seen. Following the vessels pointed by yellow arrows in each Z-stack demonstrate that V4LP vessel is a part of SIV running ventral to pancreas. Supraintestinal artery (SIA) and supraintestinal vein (SIV) are indicated by white arrowheads and sandwiched between yellow arrowheads, respectively. Scale bars: 100 μm. |
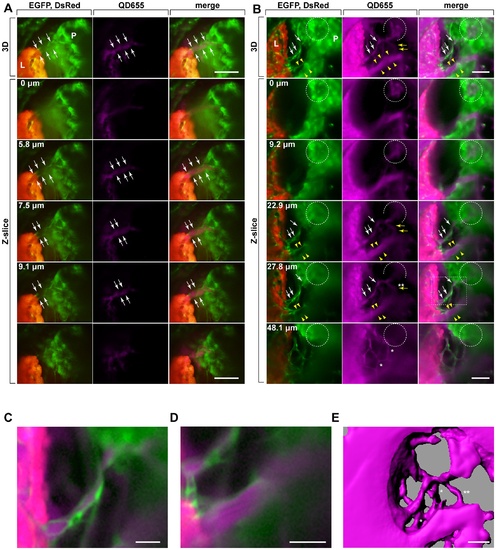
Delineation of V1LP, V2LP and V4LP vascular connections by quantum dots. QD655 injected Tg(lfabf:DsRed;elaA:egfp);Tg(fli1:efgp) larva is shown. The 3D rendered confocal microscopy images (the top panel: 3D) and their serial optical sections (bottom panels: Z-slice) of Tg(lfabf:DsRed;elaA:egfp);Tg(fli1:egfp) at 6 dpf are shown. The bottom five panels are Z-slices of the 3D rendered images shown at the top panel. The depth of each slice is indicated as µm at the top left in each panel of Z-slice. V1LP and V2LP vessels are sandwiched between white arrows and outlined by white arrows, respectively. V4LP vessel is outlined by yellow arrows and sandwiched between yellow arrowheads. The islet of Langerhans is indicated (dotted circle in each panel). The islet of Langerhans, consisting of endocrine cells, was identified as an area devoid of EGFP reporter signals driven by the exocrine pancreas-specific elaA promoter. The left, middle and right panels in A and B show EGFP (green: fli1+ vessels, elaA+ exocrine-pancreas)/DsRed (orange: lfabf+ liver), QD655 (magenta) and merged images, respectively. A. The QD655 perfused V1LP vessel. The fli1+ V1LP vessel (green) is perfused with Q655 (magenta) albeit only faintly. B. The QD655 perfused V2LP and V4LP vessels. V2LP and V4LP vessels are outlined by white and yellow arrows, respectively. By following each serial Z-slices, the direct connection of V2LP vessel (white arrows) to vascular plexus at the islet of Langerhans (dotted circle) is discernable. V4LP vessel (yellow arrows and sandwiched between yellow arrowheads) is clearly connected to intrahepatic vasculature. There are three branches (two indicated by *, one indicated by**) stemming from V4LP that appear to bridge between V2LP and V4LP vessels. By following the serial Z-slices, it is clear that two of these QD655 perfused vessels indicated by * become more discernable as V2LP becomes fainter (compare the 4th and 5th Z-slices in the QD655 column), suggesting that those two indicated by * are not directly linked to either V2LP or V4LP vessels. Instead, they cross behind V2LP vessel. In contrast, the one indicated by ** appears to be on the same Z-slice plane as V2LP vessel (compare the 4th and 5th Z-slices in the QD655 column), suggesting that this vessel (**) is a branch that directly bridge between V2LP and V4LP vessels. C. Higher magnification of the V2LP vessel showing co-localization of fli1+ vascular endothelial cells (green) and QD655 signal (magenta) (of the 4th panel of the merge column as indicated by dotted rectangle). D. Higher magnification of the V4LP vessel showing co-localization of fli1+ vascular endothelial cells (green) and QD655 signal (magenta) (of the 3rd panel of the merge column as indicated by dotted rectangle). E. IsoSurface object image of QD655 perfused vessel connections of V2LP and V4LP and their branches. The QD655 perfused vessel image was treated by surface rendering method and IsoSurface object was built (Threshold = 12). In this surface rendered image, all three branches (? and **) stemming from V4LP vessel appear to be fused to V2LP vessel. However, as demonstrated by Z-slices shown in C., two (?) are crossing behind V2LP vessel, and the one (**) fuses with V2LP vessel. Scale bars: A, B: 50 μm; C–E: 25 μm. |
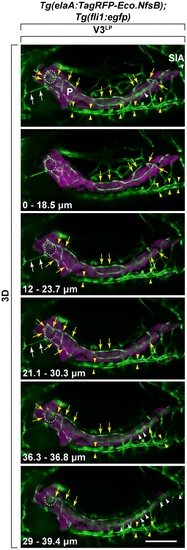
Identification of V3LP vessel that bridges between liver and pancreas. V3LP vessel originates from supraintestinal arteries (SIA). The origins of V3LP was followed by using Tg(elaA:TagRFP-Eco.NfsB);Tg(fli1:egfp) at 5 dpf. The 3D-rendered Z-stack confocal miscroscopy images of several Z-slices (depth of ranges is indicated at the bottom left in each panel) are shown in series. Fli1+ vessels and elaA+ exocrine pancreas are shown as green and magenta, respectively. By following SIA (white arrowheads) in each Z-stack, V3LP is found to be connected to a dorsal SIA branch (yellow arrows), to vascular plexus at the islet of Langerhans (dotted circle) that is linked to both dorsal (yellow arrows) and ventral (white arrowheads) SIA branches, and to SIV (sandwiched between yellow arrowheads), a part of which appears to be embedded inside pancreas. Supraintestinal artery (SIA): White arrowheads; Supraintestinal vein (SIV): Sandwiched between yellow arrowheads. Scale bars: 100 μm. |
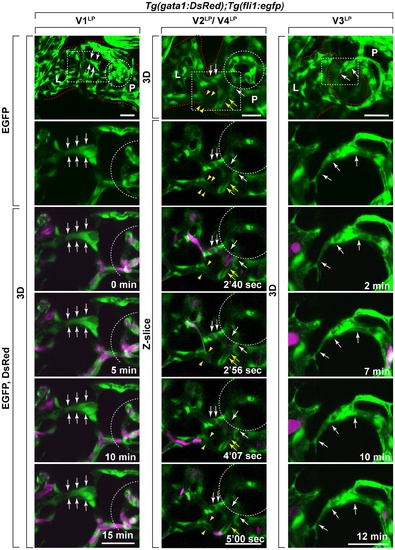
Identification of the circulation of gata1+ blood cells through V2LP and V4LP inter-organ vessels. Time-lapse two-photon microscopy images of Tg(gata1:DsRed);Tg(fli1:egfp) larvae at 5 dpf (V1LP, V2LP, V4LP) and at 6 dpf (V3LP). No circulation of gata1+ blood cells was observed within V1LP or V3LP vessels during the 15 min. or 14 min. imaging periods, respectively. In contrast, the circulation of gata1+ blood cells was clearly observed both within V2LP and V4LP vessels during the 7 min. imaging period. The 3D rendered (3D) and/or Z-slices are shown. EGFP (green): fli1+ vessels; DsRed (magenta): gata1+ blood cells. The time-stamp (min: minute, sec: second) is indicated at the bottom right in each bottom panel. Scale bars: 30 μm. |
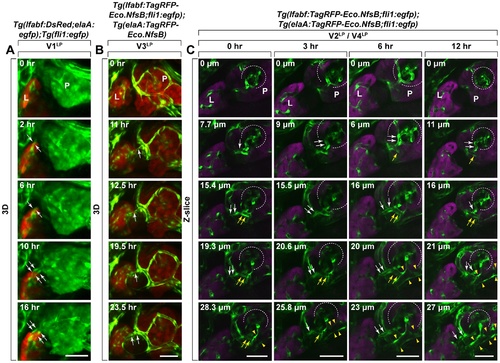
Dynamics of the formation of V1LP and V3LP vessels. The dynamic behavior of growing V1LP, V3LP, V2LP/V4LP inter-organ vessels were analyzed by time-lapse confocal microscopy using Tg(lfabf:DsRed;elaA:egfp);Tg(fli1:egfp) (A) and Tg(lfabf:TagRFP-Eco.nfsB;fli1:egfp);Tg(e laA:TagRFP-Eco.nfsB) (B) larvae, respectively. A. Panels show images from right side of larva with dorsal up, and the images were captured beginning at about 4–4.5 dpf. The V1LP vessel (EGFP: green) on the dorsal side (sandwhiched between white arrows) grows out of liver (DsRed: orange) and invades into pancreas (EGFP: green). B. Panels show images from right side of larva with dorsal up, and the images were captured beginning at about 4.5 dpf. The V3LP vessel (EGFP: green) on the dorsal side (white arrows) grows out of pancreas (TagRFP: orange) and invades into liver (TagRFP: orange). Time (h) elapsed since the beginning of the sequence is indicated at the top right in each panel. C. Panels show images from right side of larva with dorsal up, and the images were captured beginning at about 4 dpf. The embryo was observed at 0 hr, 3rd hr, 6th hr and 12th hr. V2LP vessel (white arrows) branches off from the vascular plexus in Islet of Langerhans of pancreas was observed at 0 hr, but it connects with hepatic vascular network by 12th hr. V4LP vessel (yellow arrows and sandwiched between yellow arrowheads) that is linking between V2LP (white arrows) and SIV(sandwiched between yellow arrowhead) was also observed. L: Liver, P: Pancreas. Scale bars: A, B: 40 μm; C: 30 μm. |
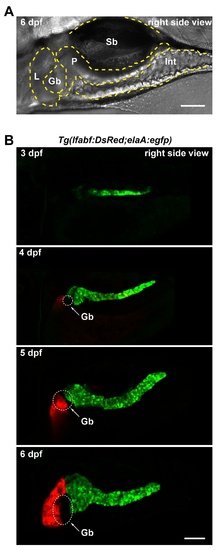
Growth of liver and pancreas between 3 dpf and 6 dpf in developing zebrafish. A. A zebrafish larva at 6 dpf imaged from the right side of the body showing the relative positions of liver (L), pancreas (P), gallbladder (Gb), swimbladder (Sb) and intestine (Int). The anterior and posterior sides on the left and right, respectively. B. The growth of pancreas and liver. The liver (orange) and pancreas (green) were visualized at 3, 4, 5 and 6 dpf using Tg(lfabf:DsRed;elaA:egfp). Gb: Gallbladder. Scale bars: 100 μm. |