
- Title
-
Eif3ba regulates cranial neural crest development by modulating p53 in zebrafish
- Authors
- Xia, Z., Tong, X., Liang, F., Zhang, Y., Kuok, C., Zhang, Y., Liu, X., Zhu, Z., Lin, S., and Zhang, B.
- Source
- Full text @ Dev. Biol.
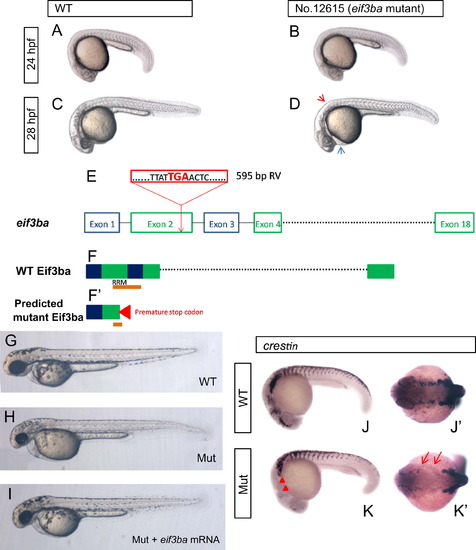
Phenotype analysis and proviral insertion mapping of zebrafish No. 12615 retrovirus insertional mutant. (A)–(D) Images of the phenotype of No. 12615 homozygous mutant embryos under bright-field. At 24 hpf, the mutant embryo (B) is indistinguishable from the wild-type (A); at 28 hpf, the mutant embryo (D) exhibits less pigmentation (red arrowhead) and slight edema of the pericardial cavity (blue arrowhead) than those of the wild-type (C). (E) eif3ba gene structure. Exogenous retroviral (RV) sequence (red box) inserted into the 2nd exon of eif3ba gene, and resulting in a pre-mature stop codon ‘TGA’. (F, F′) Predicted protein structure of Eif3ba, with part of the second and third exons encoding the important RNA-recognition motif (RRM) domain (orange bar) (F), while in the mutant, the ‘TGA’ stop codon in the proviral sequence leads to the production of a truncated protein which breaks the RRM domain at the second exon (F′). (G)–(I) The mutant embryos are largely rescued by injecting eif3ba mRNA. The injected mutant embryos (n=30/30) (I) show more pigmentation than the control (H) at 2 dpf, and the head morphology is more normal. (J)–(K′) The expression of crestin in the mutant embryos compared with the wild-type at 24 hpf. The expression of crestin dramatically decreased in the mutant embryos, specifically in the cranial region (red triangles) and the branchial primordia (red arrows). WT, wild type; Mut, eif3ba mutant. (A–D, G–I, J, K) Lateral view with anterior to the left and dorsal up; (J′, K′) dorsal view with anterior to the left. |
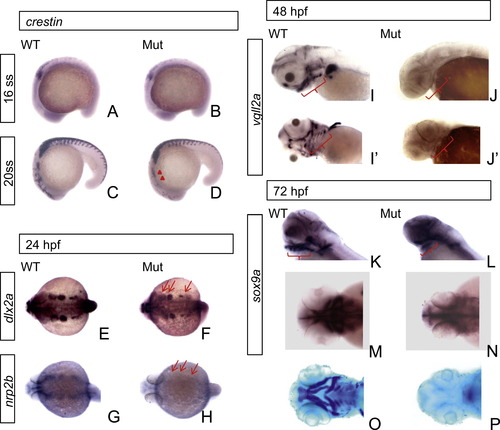
Abnormal development of cranial NCCs and their derivative tissues in the eif3ba mutant. (A)–(D) The expression of crestin in the mutant compared with the wild-type at 16 ss and 20 ss. While at 16 ss, there is little difference in the staining between wild-type and mutant embryos(A, B), the expression of crestin starts to decrease specifically in the cranial region at 20 ss (C, D, red triangles). (E)–(H) The migration pattern of cranial NCCs in the branchial primordia differs between the mutant and the wild-type embryos as revealed by in situ hybridization. The expressions of both dlx2a (E, F) and nrp2b (G, H) are reduced in the branchial primordia (red arrows) of mutant embryos at 24 hpf. (I)–(L) The PAs (red brackets) did not form in the mutants as revealed by in situ hybridization of vgll2a at 48 hpf and sox9a at 72 hpf. (M)–(P) At 72 hpf, the facial cartilage structure is revealed by sox9a in situ hybridization (M, N) or Alcian blue staining (O, P). WT, wild type; Mut, eif3ba mutant. (A–D, I, J) Lateral view with anterior to the left and dorsal up; (E–H, M–P) dorsal view with anterior to the left; (I′, J′) ventral view with anterior to the left. EXPRESSION / LABELING:
PHENOTYPE:
|
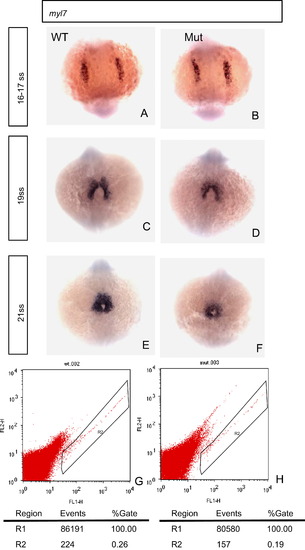
Heart development is affected in the eif3ba mutant as shown by myl7 in situ hybridization and FACS analyses. (A, B) At 16–17 ss, the development of the cardiomyocytes appears normal in the mutant compared with the wild-type. (C, D) At 19 ss, the boundary of the myl7 expression region is wider and the signal is stronger in the wild-type than in the mutant. (E, F) At 20 ss, the myocardium is thicker in the wild-type than in the mutant. (G, H) FACS analysis of the EGFP-positive cells of both wild-type and mutant embryos (20 embryos in each group, 28 hpf), on the background of the Tg(myl7:EGFP) fish line. The number of EGFP-positive cardiomyocytes in the mutant is significantly fewer than that in the wild-type. WT, wild type; Mut, eif3ba mutant. (A)–(F) The embryos are in dorsal view with anterior down. EXPRESSION / LABELING:
PHENOTYPE:
|
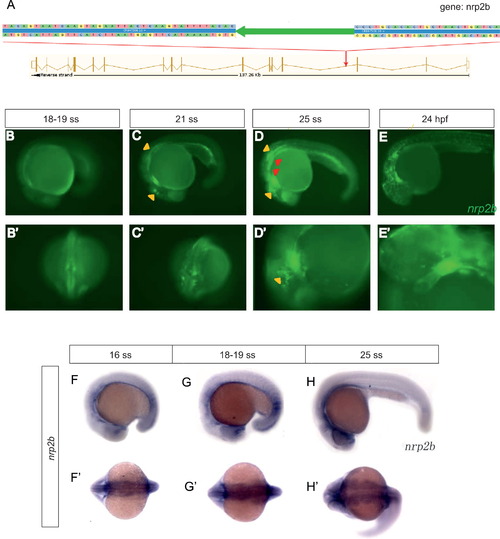
Characterization of Et(gata2a:EGFP)pku418 fish line. (A) Insertion mapping result shows that the Tol2 transposon element (large green arrow) is inserted into the 3rd intron of the nrp2b gene. The transposon insertion contains an EGFP reporter gene driven by the zebrafish gata2a minimal promoter. The direction of the transposon insertion (indicated by the direction of the green arrow) is the same as the direction of nrp2b transcription. The genomic sequence flanking the transposon element is also shown. (B)–(E′) The EGFP expression recapitulates that of nrp2b. EGFP-positive cells reach the primary heart field (red arrows) as early as 19 ss (B, B′). By 21 ss (C, C′), the bilateral myocardium precursors merge to form one intact heart (red arrow), and move to the left axis of the embryo. By 25 ss (D, D′), cranial NCC-derived tissues, including brain neurons (yellow triangles, also in C), branchial arches (red triangles), pigment cells (yellow arrow) and heart (red arrow), are all clearly labeled by the green fluorescence signal. The cranial NCCs continue to migrate, and at 24 hpf (E, E′), some pigment cells (yellow arrows) in the anterior trunk start to be labeled with EGFP, and the cardiac NCCs gradually invade the whole heart tube (red arrow). (F)–(H′) The nrp2b mRNA transcriptional pattern detected by in situ hybridization. (B–E, D′, E′, F–H) Lateral view with anterior to the left and dorsal up; (B′, C′) dorsal view with anterior down; (F′–H′) dorsal view with anterior to the left. EXPRESSION / LABELING:
|
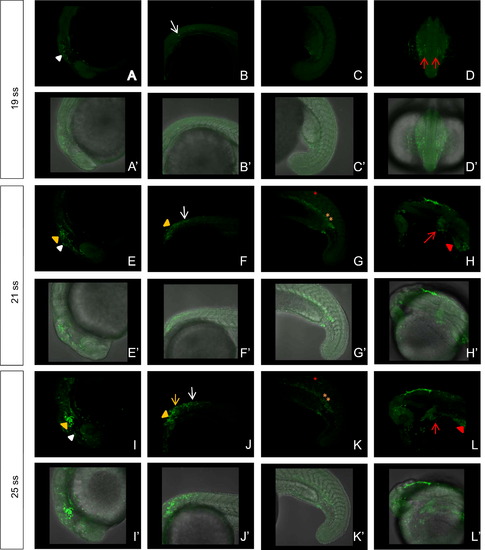
Tracing the migration of cranial NCCs in Et(gata2a:EGFP)pku418 fish line during early developmental stages from 19 ss to 25 ss. (A)–(L) The dynamic EGFP expression pattern revealed by confocal microscopy of the head (A, E, I), trunk (B, C, F, G, J, K) and heart (D, H, L) regions of the Et(gata2a:EGFP)pku418 fish line. (A, B) Pre-migratory NCCs in the head (white triangle) and the anterior trunk (white arrow) of 19 ss embryos. (C) No EGFP-positive cells are present in the tail at 19 ss. (D) EGFP-positive cells reach the primary heart field (red arrows). (E)–(G) Pre-migratory and migrating NCCs in the head (white triangle) and the anterior trunk (white arrow) of 21 ss embryos. Cranial NCC-derived tissues, including some brain neurons (yellow triangles) and some non-NCC-derived, but also nrp2b-expressing tissues, including cells in the gut endoderm (yellow asterisks) and spinal cord neurons (red asterisk), are all labeled by the green fluorescence signal. (H) By 21 ss, the bilateral myocardium precursors merge to form one intact heart, and EGFP-positive cells are clearly detected in the primordial heart (red arrow) and branchial arches (red triangle). (I)–(L) Migrating NCCs in the head (white triangle) and the anterior trunk (white arrow) of 25 ss embryos. Some pigment cells are labeled by the fluorescence signal (yellow arrow) in addition to other EGFP-positive tissues. (A′)–(L′) Bright field images merged with the corresponding fluorescent images from (A)–(L). EXPRESSION / LABELING:
|
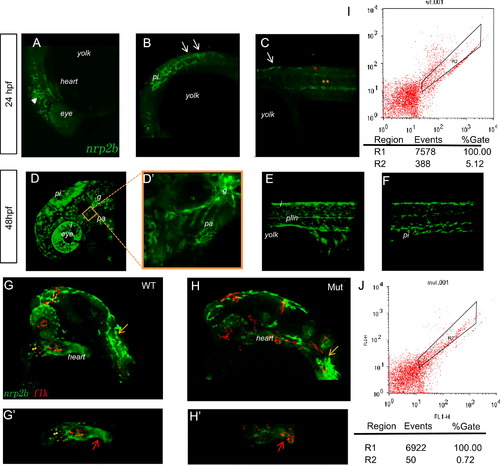
Tracing the migration of cranial NCCs in Et(gata2a:EGFP)pku418 fish line from 24 hpf to 48 hpf. (A)–(F) The dynamic EGFP expression pattern in the head (A, D, D′) and trunk (B, C, E, F) of Et(gata2a:EGFP)pku418 fish line revealed by confocal microscopy. (A)–(C) Pre-migratory and migrating NCCs in the head (white triangle) and on the medial pathway in the anterior trunk (white arrows) at 24 hpf. Gut endoderms are indicated by yellow asterisks and spinal cord neurons by red asterisks. (D)–(F) At 48 hpf, EGFP-positive cells include NCCs in the pharyngeal arches (pa), glial precursors (g), iridophores (i), pigment cells (pi), and Schwann cell precursors of the posterior lateral line nerve (plln). (D′) A higher magnification image of the pharyngeal arch region of (D). Lateral view with anterior to the left and dorsal up. (G)–(H′) Confocal images to reveal the heart region of zebrafish embryos from Et(gata2a:EGFP)pku418 crossed with the Tg(flk:mCherry) fish line. The EGFP-labeled cardiac NCCs are found at the OFT (red arrow) and also spread through the whole heart, but do not overlap with the mCherry-positive endocardial cells (G, G2). The mutant heart has reduced numbers and staining-intensity of cardiac NCCs (H, H′), while the mCherry-labeled endocardial cells and the pigment cells (yellow arrows) remain normal at 24 hpf. (G′, H′) show the heart region of the embryos from (G, H), respectively. (I–J) FACS analyses of the numbers of EGFP-positive cells in the heart from both wild-type and eif3ba mutant embryos (<70 isolated hearts for each genotype, 28 hpf) on the background of the Et(gata2a:EGFP)pku418 fish line. The numbers of EGFP-positive cells in the mutant heart are much fewer than in wild-type embryos. WT, wild type; Mut, eif3ba mutant. |
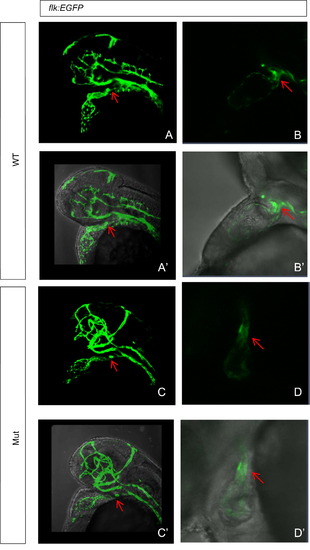
Abnormal development of cardiac NCCs contributes to heart defects in the eif3ba mutant shown by Tg(flk:EGFP) fish line. (A)–(D′) The bulbus arteriosus (OFT, arrow) normally forms at <2 dpf in the wild-type, while in the mutant at the same stage, the OFT remains in the shape of a long tube. (B, B′, D, D′) Higher magnification images of the OFT in wild-type and mutant embryos. (A)–(D) Fluorescence images captured under the confocal microscope. (A′)–(D′) Bright field images merged with the corresponding fluorescence images from (A)–(D). WT, wild type; Mut, eif3ba mutant. PHENOTYPE:
|
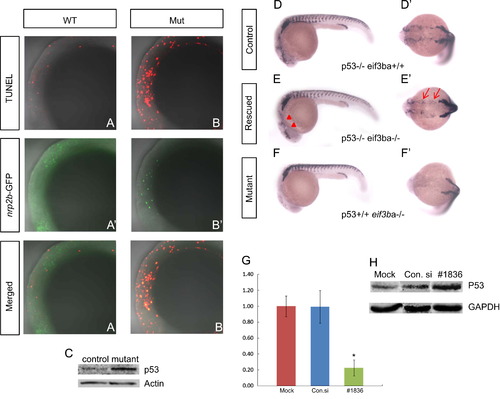
TUNEL assay and genetic interaction between eif3ba and p53. (A)–(B′′). Double-labeling with TUNEL (A, B) and anti-EGFP immunofluorescence staining (A′)–(B′) on the background of the Et(gata2a:EGFP)pku418 line at 22 ss. The neural crest lineage in the cranial region is undergoing apoptosis in the eif3ba mutant (A′′)–(B′′). (C) Western blot result shows the up-regulation of p53 in the eif3ba mutants compared with their normal siblings (Control). (D)–(F′) In the p53-/- background, the crestin expression is recovered in the cranial region (red triangles) and branchial primordia (red arrows) in the eif3ba mutant embryos at 24 hpf. (G) Efficiency and effect of EIF3B knockdown by RNA interference in HeLa cells. The abundance of EIF3B mRNA is remarkably reduced after siRNA transfection, as shown by real-time RT-PCR (p<0.01, #1836). (H) Western blot detection of p53 expression in EIF3B-siRNA-treated HeLa cells. p53 is up-regulated in the treated group compared with the controls. WT, wild type; Mut, eif3ba mutant. (G, H) Mock: cells were transfected without any RNA; Con.si: cells were transfected with negative control RNA; #1836: cells were transfected with #1836 siRNA against human EIF3B. (A–B′′, D–F) Lateral view with anterior to the left and dorsal up; (D′)–(F′) dorsal view with anterior to the left. EXPRESSION / LABELING:
PHENOTYPE:
|
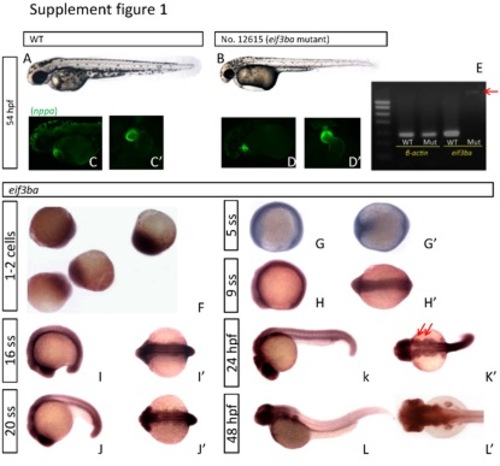
Phenotype analysis of eif3ba mutant at later developmental stages and expression pattern analysis of eif3ba. (A-B) At ~2 dpf, the mutant embryo (B) exhibits visible defects including delayed pigmentation, craniofacial malformation, and intumescent pericardial cavity and venous sinus. (C-D′) Heart morphology revealed by crossing the eif3ba mutation with Et(gata2a:EGFP)pku3, a transgenic fish line with its EGFP reporter gene recapitulating the expression pattern of nppa. At 2 dpf, the wild-type heart (C, C′) has completely finished looping, while the heart of the mutant (D, D′) is still prolonged due to incomplete looping. (E) RT-PCR results of eif3ba in wild-type and mutant embryos. The mRNA level is dramatically reduced in the mutant, and only a faint longer strip (red arrow) containing the 595-bp RV sequence is detectable. (F-I′) In situ hybridization results of eif3ba in zebrafish embryos. The eif3ba mRNA is expressed throughout the embryo from the 1-cell stage to 16 ss. (J-L′) The expression pattern of eif3ba from 20 ss to 48 hpf. The cranial region stains darker at 20 ss (J) and 24 hpf (K) than the trunk. Particularly, at 24 hpf eif3ba is strongly expressed in the branchial primordia (K′, red arrows), which are thought to be in the cranial NCC migration pathway. At 48 hpf, eif3ba is expressed in the brain (L, L′). WT, wild type. (A-D, G-L) Lateral view with anterior to the left and dorsal up; (G′-L′) dorsal view with anterior to the left; (C′-D′) ventral view. |
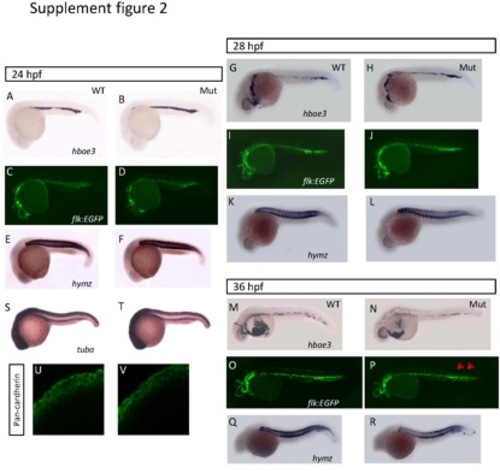
The development of tissues derived from mesoderm and epithelia in the eif3ba mutant. (A-R) Analyses of the development of tissues derived from mesoderm. We examined the development of blood cells (A-B, G-H, M-N) by hbae3 in situ hybridization, blood vessels (C-D, I-J, O-P) on the background of the Tg(flk:EGFP) transgenic fish line, and muscle (E-F, K-L, Q-R) by myhz in situ hybridization, at different stages in wild-type and mutant embryos. From 24 hpf (A-D) to 28 hpf (G-L), no differences are detectable in any of these tissues between the mutants and the wild-type embryos. At 36 hpf (M-R), the blood cells become fewer, the growth of the blood vessels is incomplete at the tail (blue arrows), and the muscle is hypotrophic in the mutants compared with the wild-type embryos. (S-V) Analyses of the development of tissues derived from epithelia. We examined the facial epithelia by tuba in situ hybridization (S-T) and pan-cadherin immuno-staining (U-V) at 24 hpf, and found no differences between the wild-type and eif3ba mutants. (A-T) Lateral view with anterior to the left and dorsal up. WT, wild type; Mut, eif3ba mutant. |
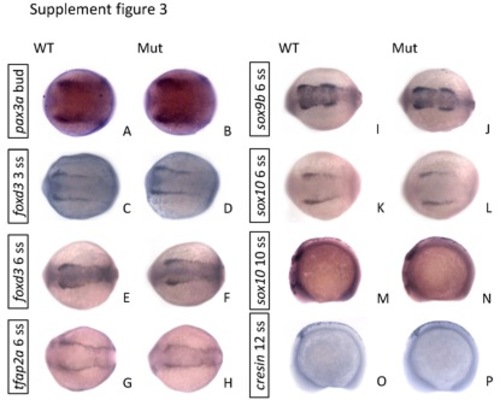
The expression of early neural crest markers showed no differences between the eif3ba mutant and wild-type embryos from bud stage to 12 ss. (A-L) The embryos are in dorsal view with anterior to the left; (M-P) lateral view with anterior to the left and dorsal up. WT, wild type; Mut, eif3ba mutant. |
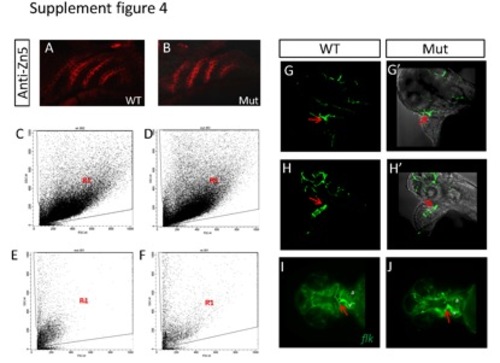
(A-B) The expression of the endoderm-derived pharyngeal pouches is not affected in the mutant as shown by immuno-staining with Zn5 antibody. (C-D) The characteristics of cells digested from whole embryos of WT (C) and mutant (D) genotype. Region 1 (R1) distinguishes the intact cells from debris. (E-F) The characteristics of cells digested from whole hearts of embryos with the WT (E) and mutant (F) genotype. (G-H′) A small, disorganized bulbus arteriosus (red arrow) forms at about 72 hpf in the eif3ba mutant crossed into the Tg(flk:EGFP) background (H-H′), compared with the completely-formed funneled structure in the wild-type embryo (G-G′). (G, H) Fluorescent images recorded under the confocal microscope. (G′, H′) Bright field images merged with the corresponding fluorescent images from (G, H). (I, J) Ventral view of Tg(flk:EGFP) embryos with anterior to the left, showing the abnormal OFT structure (red arrow) in the mutant compared with the normal structure in the wild-type embryo. a, atrium; v, ventricle. WT, wild type; Mut, eif3ba mutant. (G-H′) Lateral view with anterior up; (I-J) ventral view with anterior to the left. |
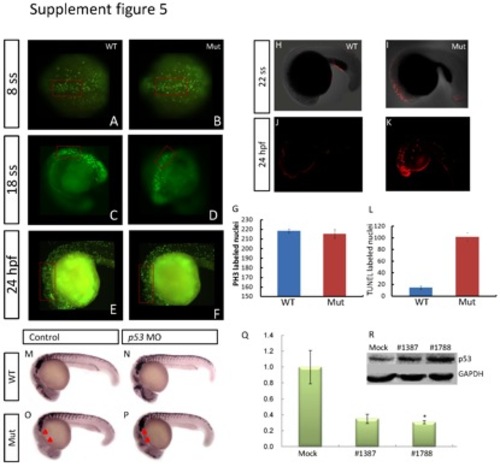
Evaluation of cell proliferation and apoptosis, and the interaction between p53 and eif3ba. (A-G) Cell proliferation detected by PH3 immunofluorescence staining at 24 hpf. Compared with their wild-type siblings (A, C, E), the number of PH3-positive nuclei in the dorsal neuroepithelial regions (red rectangles) is slightly reduced in the eif3ba mutant embryos (B, D, F). (G) Graph of PH3-labeled nuclei at 24 hpf comparing the wild-type with the mutant embryos. (H-L) Whole-mount TUNEL staining of zebrafish embryos at 22 ss and 24 hpf. Apoptosis in the cranial neuroepithelium is more sever in the mutants (I, K) than in the wild-type embryos (H, J). (L) Graph of TUNEL-labeled nuclei at 24 hpf comparing the wild-type and mutant embryos. (M-P) p53 MO injection rescues the crestin expression in the cranial region in the eif3ba mutant embryos at 24 hpf. The untreated mutant (O) has fewer cranial NCCs than the wild-type control (M), while the crestin expression (red triangles) is recovered in the p53 MO-injected mutant (P). (Q) Efficiency and effect of EIF3B knockdown by two more siRNAs in HeLa cells. The abundance of EIF3B mRNA is reduced after siRNA transfection as shown by real-time RT-PCR (*p <0.05, #1788). (R) Western blot detection of p53 expression in EIF3B-siRNA-treated HeLa cells. p53 is up-regulated in both siRNA-treated groups compared with the negative control. #1387 and #1788: cells were transfected with the corresponding siRNA against human EIF3B. |

Unillustrated author statements PHENOTYPE:
|
Reprinted from Developmental Biology, 381(1), Xia, Z., Tong, X., Liang, F., Zhang, Y., Kuok, C., Zhang, Y., Liu, X., Zhu, Z., Lin, S., and Zhang, B., Eif3ba regulates cranial neural crest development by modulating p53 in zebrafish, 83-96, Copyright (2013) with permission from Elsevier. Full text @ Dev. Biol.