
- Title
-
Zebrafish rhabdomyosarcoma reflects the developmental stage of oncogene expression during myogenesis
- Authors
- Storer, N.Y., White, R.M., Uong, A., Price, E., Nielsen, G.P., Langenau, D.M., and Zon, L.I.
- Source
- Full text @ Development
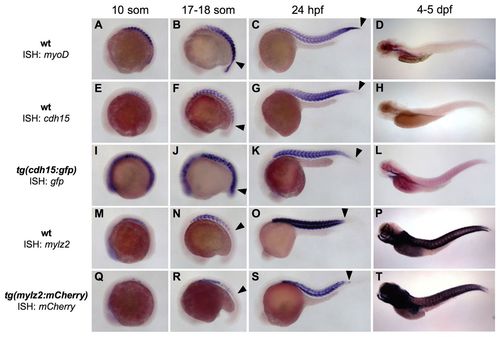
cdh15 and mylz2 transgenic muscle promoters recapitulate endogenous expression patterns during development and turn on at different times during somite formation. Whole-mount RNA in situ hybridization was performed on endogenous genes in AB strain wild-type embryos (A-H,M-P), or the GFP (I-L) or mCherry (Q-T) transcript in transgenic embryos. dpf, days post-fertilization; hpf, hours post-fertilization; som, somite stage. Anterior is on the left. Arrowheads denote the location of the most posteriorly stained somite. EXPRESSION / LABELING:
|
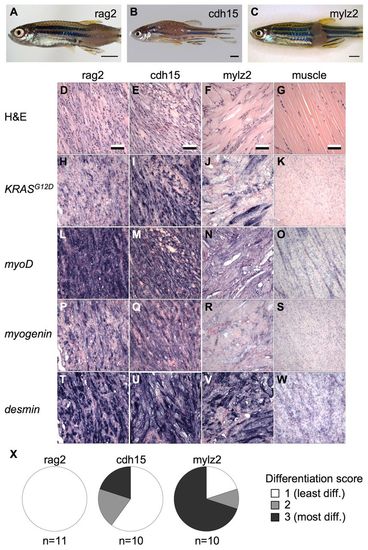
Zebrafish injected with rag2:KRASG12D, cdh15:KRASG12D or mylz2:KRASG12D develop muscle tumors that differ in histological appearance. (A-C) Brightfield images of fish bearing rag2 (A), cdh15 (B) and mylz2 (C) tumors. (D-G) H&E staining of tumors. (H-W) Tumors express diagnostic markers of RMS as assessed by RNA in situ hybridization. Histological sections of representative rag2 (D,H,L,P,T), cdh15 (E,I,M,Q,U) and mylz2 (F,J,N,R,V) tumors and normal muscle (G,K,O,S,W). Images in D-W are at the same magnification. (X) Tumors were assigned differentiation scores based on histological appearance. Scale bars: in A-C, 2 mm; in D-G, 50 μm. |

Survival of tumor-bearing fish differs in rag2, cdh15 and mylz2 tumors. (A) Fish injected with rag2:KRASG12D, cdh15:KRASG12D or mylz2:KRASG12D transgenes developed tumors with differing latency and incidence (mylz2, n=19/117; rag2, n=50/144; cdh15, n=42/146 fish developed tumors; rag2 versus mylz2, P=0.0004; cdh15 versus mylz2, P<0.0001; rag2 versus cdh15, P=0.73). (B) mylz2 tumor-bearing fish displayed better survival over time compared with rag2 and cdh15 tumor-bearing fish (rag2, n=50; cdh15, n=48; mylz2, n=22; rag2 versus mylz2, P=0.001; cdh15 versus mylz2, P=0.009; rag2 versus cdh15, P=0.72). P-values for A and B were calculated using the log-rank test. (C-L) Rates of EdU incorporation did not significantly differ among the tumor models. Fluorescent microscopic images depicting DAPI-positive (C,F,I) and EdU-positive (D,G,J) nuclei. (E,H,K) Merged images. (C-E) rag2 tumor. (F-H) cdh15 tumor. (I-K) mylz2 tumor. (L) Quantification of the ratio of EdU-positive to total nuclei. n=4 for each tumor model; P>0.05, Student’s t-test. Ratios were calculated based on the average ratio for three separate high-power images per tumor. Error bars represent s.e.m. |
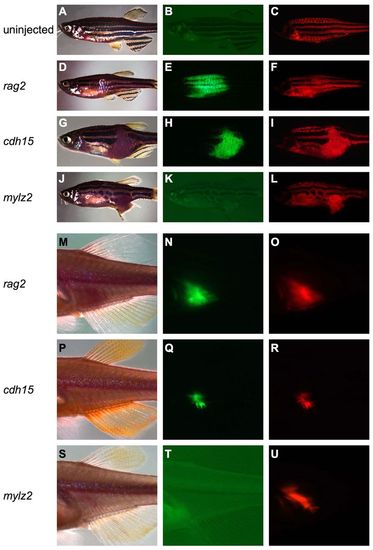
Tumors in the myf5:GFP;mylz2:mCherry background differ in the degree of GFP fluorescence. (A-L) Brightfield (A,D,G,J), GFP (B,E,H,K) and mCherry (C,F,I,L) fluorescent images of uninjected fish (A-C) or tumor-bearing fish that had been injected with the rag2:KRASG12D (D-F), cdh15:KRASG12D (G-I) or mylz2:KRASG12D (J-L) transgenes at the one-cell stage. (M-U) Engrafted, secondary tumors in irradiated casper recipient fish display similar patterns of fluorescence to their respective primary, parent tumors. Brightfield (M,P,S), GFP fluorescence (N,Q,T), and mCherry fluorescence (O,R,U) images of casper fish transplanted with G+R- cells from a rag2 tumor (M-O), cdh15 tumor (P-R) or mylz2 tumor (S-U). |
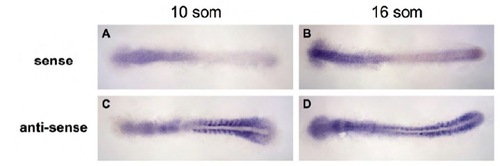
The cdh15 transgenic muscle promoter is expressed in developing somites during early and midsomitogenesis. (A-D) Whole-mount RNA in situ hybridization was performed on 10 somite (A,C) and 16 somite (B,D) cdh15:GFP transgenic embryos using GFP anti-sense (C,D) RNA probes or sense (A,B) control probes. Flat-mounted embryos are depicted, with anterior on the left. Significant background staining is seen in the anterior embryo in sense controls. High levels of somite-specific staining are seen only in antisense probe-treated embryos. |
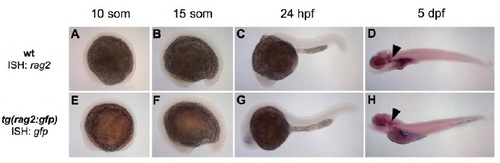
rag2 transgenic muscle promoter recapitulates endogenous expression patterns during development. (A-H) Whole-mount RNA in situ hybridization was performed on endogenous rag2 transcript in AB strain wild-type embryos (A-D), or on GFP transcript in transgenic embryos (E-H). (A,E) 10 somite stage. (B,F) 15 somite stage. (C,G) 24 hours post fertilization (hpf). (D,H) 5 days post fertilization (dpf). Anterior is on the left. Arrowheads denote the location of the thymus in 5 dpf larvae. |

Muscle promoter-driven KRASG12D expression in mosaic transgenic embryos and larvae are largely consistent with endogenous expression patterns. (A-VV) Whole-mount RNA in situ hybridization was performed using KRAS anti-sense RNA probes (E-P,U-FF,KK-VV) or KRAS sense controls (A-D,Q-T,GG-JJ) on embryos or larvae that had been injected at the one-cell stage with rag2:KRASG12D (A-P), cdh15:KRASG12D (Q-FF), or mylz2:KRASG12D (GGVV) vectors. For each time point, one representative sense control staining and three representative anti-sense probe stainings are depicted. (A,E,I,M,Q,U,Y,CC,GG,KK,OO,SS) 10 somite stage. (B,F,J,N,R,V,Z,DD,HH,LL,PP,TT) 16 somite stage. (C,G,K,O,S,W,AA,EE,II,MM,QQ,UU) 24 hpf. (D,H,L,P,T,X,BB,FF,JJ,NN,RR,VV) 5 dpf. Black arrowheads indicate areas of muscle staining at 5 dpf. Unfilled arrowhead indicates area in one rag2 embryo (1 out of 71 embryos) that displayed a population of cells with anti-sense staining. Arrows represent positive muscle fibers in a 10 somite mylz2 embryo. |
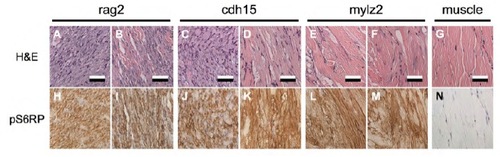
rag2:KRASG12D, cdh15:KRASG12D and mylz2:KRASG12D tumors express phospho-S6 ribosomal protein (pS6RP) at similar levels. (A-N) H&E staining (A-G) and immunohistochemistry staining of S6RP (H-N) of two representative rag2 (A,B,H,I), cdh15 (C,D,J,K) and mylz2 (E,F,L,M) tumors, or one normal muscle (G,N) section. Scale bars: 50 μm. All images are at the same magnification. |

Unillustrated author statements |