
- Title
-
Gpr125 modulates Dishevelled distribution and planar cell polarity signaling
- Authors
- Li, X., Roszko, I., Sepich, D.S., Ni, M., Hamm, H.E., Marlow, F.L., and Solnica-Krezel, L.
- Source
- Full text @ Development
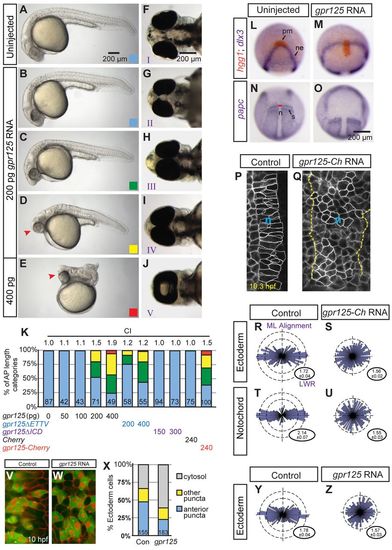
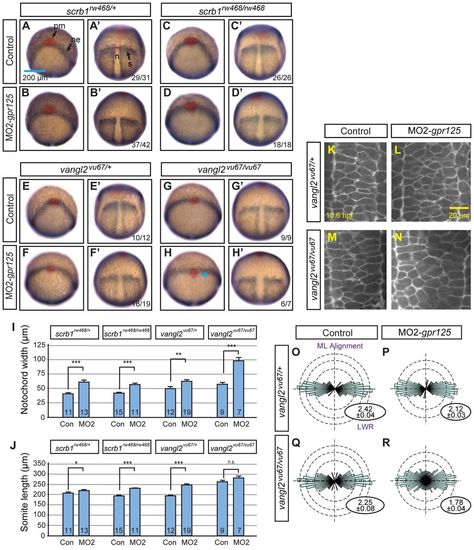
Excess Gpr125 causes C&E movement defects. (A-E) Lateral views of uninjected or gpr125 RNA injected embryos at 1 day post-fertilization (dpf). Anterior is leftwards. AP axis length phenotypic categories. Blue, greater than 95%; green, 80-95%; yellow, 40-79%; red, smaller than 40% of the average AP axis length of control embryos. Arrowheads in D and E indicate the cyclopic eyes and change of head position. (F-J) Ventral views of uninjected or gpr125 RNA-injected embryos at 3 dpf. Anterior is leftwards. Eye fusion defects were categorized into five groups (I-V) according to Marlow et al. (Marlow et al., 1998). (K) Quantification of AP axis shortening and eye fusion phenotypes. The colored bars correspond to the AP axis length phenotypic categories shown in B-E. Eye fusion phenotypes were quantified by cyclopia index (CI) according to Marlow et al. (Marlow et al., 1998). CI values are above the bars and numbers of embryos analyzed inside the bars. (L-O) Whole-mount in situ hybridization analyses of marker gene expression in uninjected or 200 pg gpr125 RNA-injected embryos at the two-somite stage. (L,M) Animal pole views, ventral upwards. (N,O) Dorsal views, anterior upwards. n, notochord; ne, neural ectoderm border; pm, prechordal mesoderm; s, somites. Red line indicates the width of the notochord at the first somites. (P,Q) mEGFP-labeled notochord (n) of control or 200 pg gpr125-Cherry RNA-injected embryos at the one-somite stage. Anterior is upwards. All measured notochord cells are outlined and the notochord boundary of the gpr125-injected embryo is marked with dashed lines. (R-U) Analyses of LWR and mediolateral (ML) alignment in the ectoderm or notochord of control (n=3 embryos, 158 and 131 cells, respectively) or 200 pg gpr125-Cherry RNA-injected embryos (n=6 embryos, 266 and 220 cells, respectively) at the one-somite stage. Rose diagrams depict cell orientation relative to the AP axis (vertical dashed line). Corresponding LWRs are expressed as mean±s.e.m. in the lower right corners. (V,W) Punctate and cytosolic distribution of Pk-GFP in control or gpr125 RNA-injected embryos. (X) Classes of Pk-GFP distribution in control or gpr125 RNA-injected embryos (155 or 183 cells, respectively). (Y,Z) ML alignment and LWR of ectodermal cells analyzed for Pk-GFP localization in control or gpr125 RNA-injected gastrulae. |
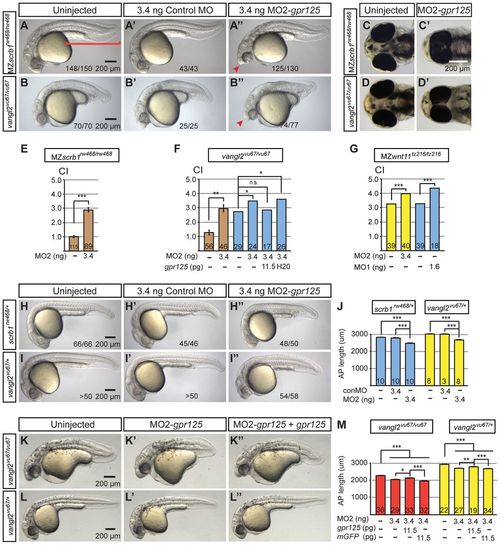
Knockdown of gpr125 enhances defects of scrbl1/llk and vangl2/tri mutants. (A-B2) Lateral views of uninjected, control MO- or MO2-gpr125-injected MZscrb1/llkrw468/rw468 or vangl2/trivu67/vu67 homozygotes at 1 dpf. Anterior is leftwards. The bracket in A marks the posterior body. Arrowheads in A and B′ indicate the cyclopic eyes and change of head position. Fractions of affecte′d embryos are indicated. (C-D′) Ventral views of uninjected or 3.4 ng MO2-gpr125-injected MZscrb1/llkrw468/rw468 or vangl2/trivu67/vu67 embryos at 3 dpf. Anterior is leftwards. (E-G) Quantification of CI of MZscrb1/llkrw468/rw468, vangl2/trivu67/vu67 and MZwnt11/slbtz216/tz216 embryos at 3 dpf injected with gpr125 MOs and/or RNA or water. The numbers of analyzed embryos are inside the bars. Brown bars represent results from three independent experiments with error bars indicating s.e.m. Yellow and blue bars show results from single experiments with results of additional repetitions shown in supplementary material Tables S2 and S3. *P<0.05, **P<0.01, ***P<0.001. (H-I′) Lateral views of uninjected, 3.4 ng control MO injected or 3.4 ng MO2-gpr125-injected MZscrb1/llkrw468/+ or vangl2/trivu67/+ heterozygotes at 1 dpf. Anterior is leftwards. Fractions of affected embryos are indicated, except for I and I2, where more than 50 embryos were analyzed. (J) Quantification of AP axis length in scrb1/llkrw468/+ and vangl2/trivu67/+ embryos at 1 dpf. The numbers of analyzed embryos are inside the bars. Error bars indicate ±s.e.m. ***P<0.001. (K-L2) Lateral views of uninjected, 3.4 ng MO2-gpr125, or 3.4 ng MO2-gpr125 and 11.5 pg gpr125 RNA co-injected vangl2/trivu67/vu67 or vangl2/trivu67/+ embryos at 1 dpf. Anterior is leftwards. (M) Quantification of the impacts of gpr125 MO and RNA on the AP axis defects of vangl2/trivu67/vu67 vangl2/trivu67/+ embryos at 1 dpf. The numbers of analyzed embryos are inside the bars. Error bars indicate ±s.e.m. *P<0.05, **P<0.01, ***P<0.001. PHENOTYPE:
|
Knockdown of gpr125 enhances defects of scrbl1/llk and vangl2/tri mutants. (A-B′) Lateral views of uninjected, control MO- or MO2-gpr125-injected MZscrb1/llkrw468/rw468 or vangl2/trivu67/vu67 homozygotes at 1 dpf. Anterior is leftwards. The bracket in A marks the posterior body. Arrowheads in A′ and B′ indicate the cyclopic eyes and change of head position. Fractions of affected embryos are indicated. (C-D′) Ventral views of uninjected or 3.4 ng MO2-gpr125-injected MZscrb1/llkrw468/rw468 or vangl2/trivu67/vu67 embryos at 3 dpf. Anterior is leftwards. (E-G) Quantification of CI of MZscrb1/llkrw468/rw468, vangl2/trivu67/vu67 and MZwnt11/slbtz216/tz216 embryos at 3 dpf injected with gpr125 MOs and/or RNA or water. The numbers of analyzed embryos are inside the bars. Brown bars represent results from three independent experiments with error bars indicating s.e.m. Yellow and blue bars show results from single experiments with results of additional repetitions shown in supplementary material Tables S2 and S3. *P<0.05, **P<0.01, ***P<0.001. (H-I2) Lateral views of uninjected, 3.4 ng control MO injected or 3.4 ng MO2-gpr125-injected MZscrb1/llkrw468/+ or vangl2/trivu67/+ heterozygotes at 1 dpf. Anterior is leftwards. Fractions of affected embryos are indicated, except for I and I′, where more than 50 embryos were analyzed. (J) Quantification of AP axis length in scrb1/llkrw468/+ and vangl2/trivu67/+ embryos at 1 dpf. The numbers of analyzed embryos are inside the bars. Error bars indicate ±s.e.m. ***P<0.001. (K-L′) Lateral views of uninjected, 3.4 ng MO2-gpr125, or 3.4 ng MO2-gpr125 and 11.5 pg gpr125 RNA co-injected vangl2/trivu67/vu67 or vangl2/trivu67/+ embryos at 1 dpf. Anterior is leftwards. (M) Quantification of the impacts of gpr125 MO and RNA on the AP axis defects of vangl2/trivu67/vu67 vangl2/trivu67/+ embryos at 1 dpf. The numbers of analyzed embryos are inside the bars. Error bars indicate ±s.e.m. *P<0.05, **P<0.01, ***P<0.001. PHENOTYPE:
|
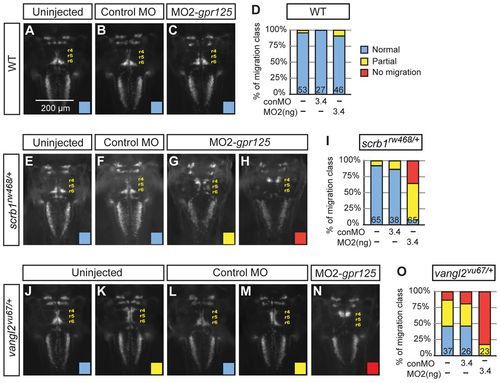
gpr125 interacts with scrb1/llk and vangl2/tri in FBMN migration. (A-C) Dorsal views of islet1(isl1):GFP-expressing neurons in uninjected, 3.4 ng control MO or 3.4 ng MO2-gpr125 injected wild-type siblings of scrb1/llk or vangl2/tri heterozygous embryos at 48 hpf. Anterior is upwards. r4 (rhombomere 4), r5 and r6 positions are labeled. (D) Frequency of FBMN migration phenotypic classes observed in wild-type embryos. Blue, normal; yellow, partial; red, no migration. (E-H) Dorsal views of isl1:GFP-expressing neurons in uninjected, 3.4 ng control MO or 3.4 ng MO2-gpr125-injected scrb1/llkrw468/+ embryos at 48 hpf. (I) Frequency of the FBMN migration phenotypic classes observed in scrb1/llkrw468/+ embryos. (J-N) Dorsal views of isl1:GFP-expressing neurons in uninjected, 3.4 ng control MO or 3.4 ng MO2-gpr125-injected vangl2/trivu67/+ embryos at 48 hpf. (O) Frequency of FBMN migration phenotypic classes observed in vangl2/trivu67/+ heterozygotes. PHENOTYPE:
|
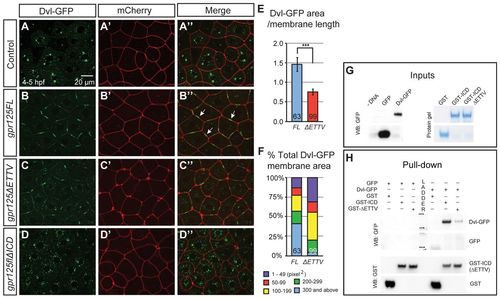
Gpr125 promotes Dvl-GFP localization in discrete membrane subdomains via direct interaction. (A-D′) Animal pole views of live embryos at 4-5 hpf co-injected with 150 pg dvl-GFP and 50 pg mCherry RNA in the absence (A-A′) and presence of 380 pg gpr125FL (B-B′), gpr125ΔETTV (C-C′) or gpr125ΔICD RNA (D-D′). Arrows in B′ indicate Dvl-GFP membrane subdomains. (E) Ratio of Dvl-GFP membrane area to the length of the membrane measured on embryos expressing full-length or ΔETTV Gpr125. Numbers of membranes analyzed are inside bars. Data are mean±s.e.m. ***P<0.001. (F) Size distribution of Dvl-GFP membrane subdomains in embryos expressing full-length or ΔETTV Gpr125. Numbers of membranes analyzed are inside bars. (G,H) Pull-down assay with GST- and GFP-fusion proteins. Ten percent of GFP-fusion protein inputs were blotted with anti-GFP antibody and 100% GST fusion protein inputs were stained with Denville Blue Protein Stain (G). Pull-down results were analyzed by western blotting using anti-GFP and anti-GST antibodies (H). |
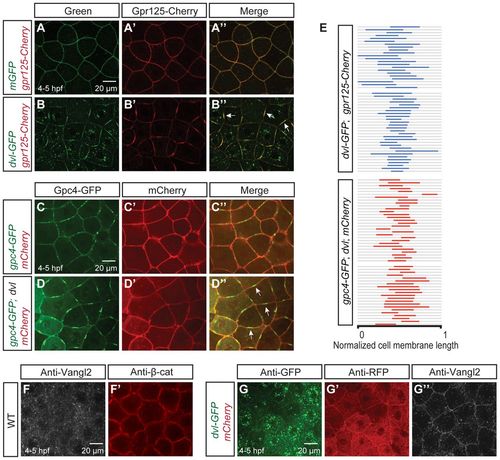
Dvl clusters Gpr125 and Gpc4/Kny into membrane subdomains and promotes uniform Vangl2/Tri membrane localization in late blastulae (4-5 hpf). (A-B′) Animal pole views of live blastulae co-injected with 267 pg gpr125-Cherry RNA and either 150 pg mEGFP RNA (A-A′) or 150 pg dvl-GFP RNA (B-B2). Arrows in B′ indicate Gpr125-Cherry:Dvl-GFP membrane subdomains. (C-D′) Animal pole views of live blastulae co-injected with 60 pg gpc4/kny-GFP RNA, 50 pg mCherry RNA (C-C′) and 150 pg dvl RNA (D-D′). Arrows in D′ indicate Gpc4/Kny-GFP membrane subdomains. (E) Graphic representation of the relative distribution of Dvl-GFP:Gpr125-Cherry and Gpc4/Kny-GFP:Dvl subdomains along cell membranes. Membrane length was normalized as one. (F,F2) Animal pole views of a whole-mount immunostained wild-type blastula with Vangl2 and β-catenin antibodies. (G-G′) Animal pole views of a 50 pg mCherry and 150 pg dvl-GFP RNA-injected blastula immunostained for GFP, RFP and Vangl2. |
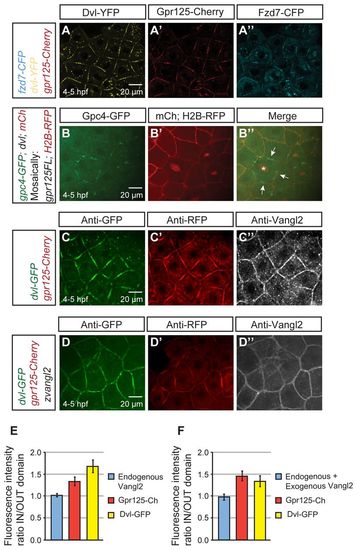
Gpr125 promotes localization of select PCP components in Dvl-containing membrane subdomains in late blastulae (4-5 hpf). (A-A′) Live blastula co-injected with 110 pg fzd7-CFP, 150 pg dvl-YFP and 300 pg gpr125-Cherry RNA. (B-B′) Live blastula co-injected with 60 pg gpc4/kny-GFP, 150 pg dvl and 50 pg mCherry at the one-cell stage, and 4 pg H2B-RFP and 20 pg gpr125FL RNA in one blastomere at the 16- to <32-cell stage. The star in B′ marks an H2B-RFP-positive nucleus and arrows indicate membrane subdomains. (C-D′) Blastula injected with 300 pg gpr125-Cherry, 150 pg dvl-GFP (C-C′) and 50 pg zebrafish vangl2/tri RNA (D-D′) immunostained for GFP, RFP and Vangl2. Animal pole views in A-D. (E,F) Quantification of fluorescence intensity ratios inside/outside domain for Vangl2, Gpr125-Cherry and Dvl-GFP in embryos injected with 300 pg gpr125-Cherry, 150 pg dvl-GFP (E) and 50 pg zebrafish vangl2 RNA (F). Data are mean±s.e.m. |
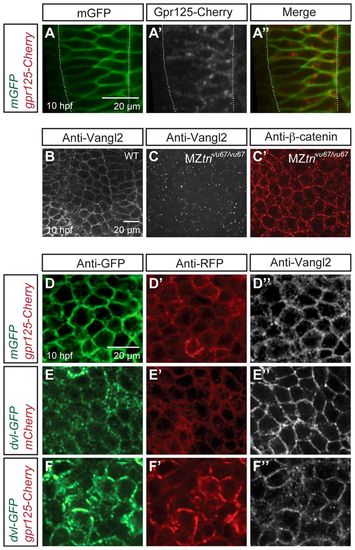
Gpr125-Cherry and Dvl-GFP colocalize during gastrulation (10 hpf). (A-A′) Dorsal views of a gastrula injected with 50 pg gpr125-Cherry and 150 pg mEGFP RNA. Broken white lines outline the notochord. (B-C′) Whole-mount immunostaining for endogenous Vangl2 and β-catenin in wild-type (B) or MZvang/trivu67/vu67 gastrulae (C-C′). (D-F′) Dorsal mesoderm of gastrulae co-injected with 150 pg mEGFP and 300 pg gpr125-Cherry RNA (D-D′), 150 pg dvl-GFP and 50 pg mCherry RNA (E-E′), or 150 pg dvl-GFP RNA and 300 pg gpr125-Cherry RNA (F-F′), and immunostained for GFP, RFP and Vangl2. |
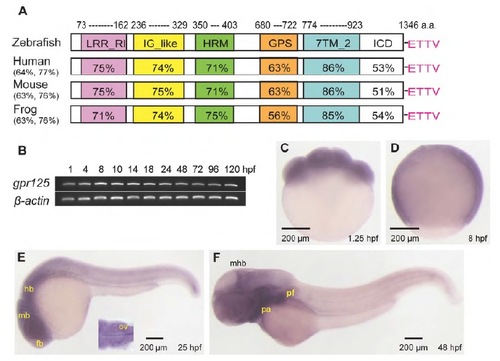
Predicted protein domains and spatiotemporal expression profile of gpr125 during early zebrafish development. (A) Schematics of predicted zebrafish Gpr125 protein domains. The percentage amino acid identity or similarity between Gpr125 peptide sequences in vertebrates for the whole protein are included in parentheses, and for individual domains on the schema. LRR_RI, leucine-rich repeat_ribonuclease inhibitor type; IG_like, immunoglobulin_like; HRM, hormone receptor domain; GPS, GPCR proteolytic site; 7TM_2, seven-pass transmembrane type 2; ICD, intracellular domain. The PDZ binding motif (ETTV) at the C-terminus are labeled in pink. (B) RT-PCR of gpr125 transcripts from 1 to 120 hpf. b-Actin was used as a loading control. (C-F) Whole-mount in situ hybridization profile of gpr125 expression. Lateral views, anterior is upwards in C,D and leftwards in E,F. fb, forebrain; hb, hindbrain; mb, midbrain; mhb, midbrain-hindbrain boundary; ov, otic vesicle; pa, pharyngeal arches; pf, pectoral fin. |
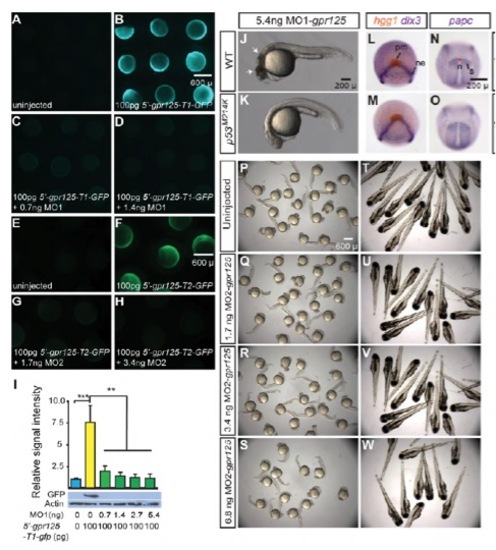
Effective gpr125 MOs cause no noticeable morphological defects in wild-type embryos. (A-D) Live images of uninjected (A), 100 pg 5′-gpr125-T1-GFP RNA (GFP reporter for MO1-gpr125) injected (B), or 100 pg 5′-gpr125-T1-GFP RNA and MO1- gpr125 co-injected embryos (C,D) at the 70%-epiboly stage. (E-H) Live images of uninjected (E), 100 pg 5′-gpr125-T2-GFP RNA (GFP reporter for MO2-gpr125) injected (F), or 100 pg 5′-gpr125-T2-GFP RNA and MO2-gpr125 co-injected embryos (G-H) at the 75% epiboly stage. (I) Western blot quantification of GFP reporter protein levels in MO1-gpr125 injected embryos. The density of the GFP bands was normalized to that of the actin bands and the signal intensity relative to uninjected embryos is shown. Error bars indicate s.e.m. **P<0.01, ***P<0.001. (J,K) Lateral views of 5.4 ng MO1-gpr125-injected wild-type (J) or p53M214K/M214K embryos (K) at 1 dpf. Anterior is leftwards. Arrows in J indicate regions of significant cell death. (L-O) Whole-mount in situ hybridization analyses of marker gene expression in uninjected (L,N) and 2.7 ng MO1-gpr125-injected embryos (M,O) at the two-somite stage. (L,M) Animal pole views, ventral is upwards. (N,O) Dorsal views, anterior is upwards. n, notochord; ne, neural ectoderm border; pm, prechordal mesoderm; s, somites. Red line in N indicates the width of the notochord at the first somites. (P-W) Uninjected embryos or embryos injected with increasing doses of MO2-gpr125 at 1 dpf or 3 dpf. PHENOTYPE:
|
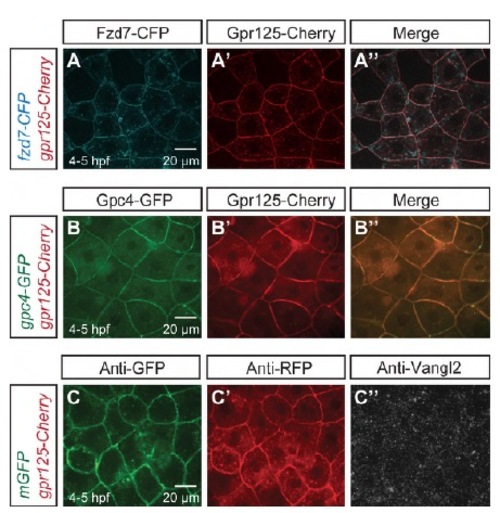
Gpr125-Cherry alone did not affect PCP components localization in late blastulae (4-5 hpf). (A-A′′) Animal pole views of a blastula co-injected with 110 pg fzd7-CFP and 300 pg gpr125-Cherry RNA. (B-B′′) Animal pole views of a blastula co-injected with 60 pg gpc4/kny-GFP and 300 pg gpr125-Cherry RNA. (C-C′′) Animal pole views of a 300 pg gpr125-Cherry and 150 pg mGFP RNA-injected blastula immunostained for GFP, RFP and Vangl2. |