
- Title
-
notch3 is essential for oligodendrocyte development and vascular integrity in zebrafish
- Authors
- Zaucker, A., Mercurio, S., Sternheim, N., Talbot, W.S., and Marlow, F.L.
- Source
- Full text @ Dis. Model. Mech.
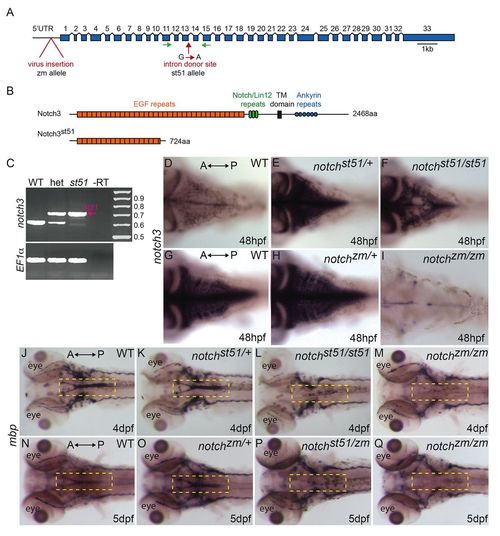
Mutations in notch3 reduce mbp mRNA expression. (A) Schematic depicting the notch3 gene and the locations of the retroviral insertion (zm allele) and of the st51 mutation. Introns are not to scale. (B) Schematic of the wild-type Notch3 protein domains and the truncated protein produced owing to the st51 mutation. (C) RT-PCR of the wild-type (WT) and st51 notch3 transcripts. (D–I) In (D,G) wild-type zebrafish, (E) notch3st51/+ and (H) notch3zm/+ heterozygotes, and (F) notch3st51/st51 mutants, notch3 transcripts were detected in the CNS. In contrast to heterozygotes and notch3st51/st51 mutants, notch3 expression was barely detectable in the CNS of (I) notch3zm/zm mutants. Panels D–F and G–I are age-matched siblings from st51 and zm clutches, respectively. (D–F) Short staining reaction. (G–I) Long staining reaction. (J–Q) Expression of mbp was similar in (J,N) wild-type zebrafish and (K,O) notch3st51/+ or notch3zm/+ heterozygotes, but was reduced in the CNS (compare yellow dashed areas in the hindbrain) of (L) notch3st51/st51 and (M,Q) notch3zm/zm homozygotes and (P) notch3st51/zm transheterozygotes, indicating that the st51 and zm mutations failed to complement. (D–Q) Dorsal views. Anterior (A) and posterior (P) are indicated. |
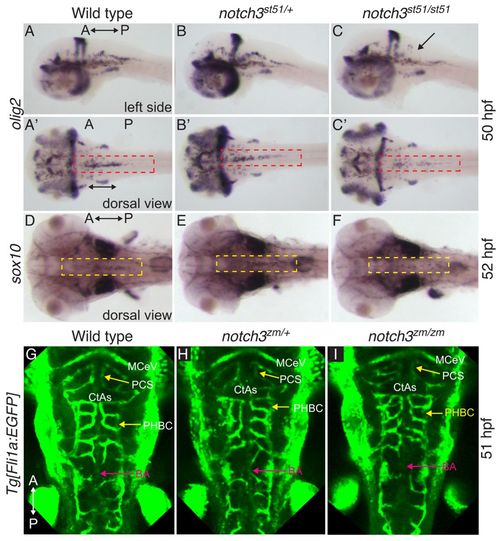
Transient reduction in OPCs in notch3 mutants at stages at which vessel patterning is intact. (A–C) olig2 at 50 hpf was similar in (A,A2) wild type and (B,B2) notch3st51/+ heterozygotes, but was reduced in OPCs (compare red dashed areas) of (C,C2) notch3st51/st51 mutants. Arrow indicates region devoid of olig2-expressing cells. (D–F) sox10 expression at 52 hpf was comparable in (D) wild type and (E) notch3st51/+ heterozygotes, but was reduced in the midline of the hindbrain (compare yellow dashed areas) in (F) notch3st51/st51 mutants. (A–C) Lateral views. (A2–C2,D–I) Dorsal views. (G–I) Vessel pattern at the anatomical level is intact in notch3zm/zm mutants. Max projection images of Tg[fli1a:EGFP] labeled vasculature of (G) wild type (n=9), (H) notch3zm/+ heterozygotes (n=9) and (I) notch3zm/zm mutants (n=5). CtAs, central arteries; PHBC, primordial hindbrain channel; BA, basilar artery; MCeV, mid-cerebral vein; PCS, posterior connecting segment. The orientation of the anterior (A) and posterior (P) axis is indicated. |
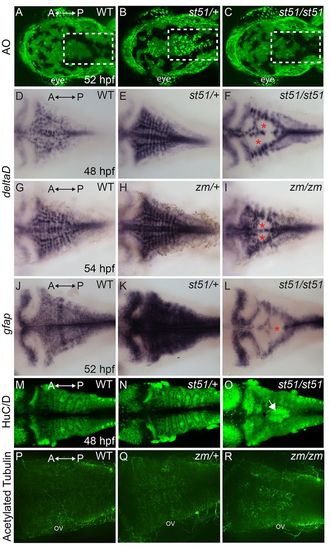
Apoptosis in notch3 heterozygotes and neurogenic phenotype of notch3 mutants. (A–C) Acridine orange (AO)-labeled embryos. The hindbrains (white dashed areas) of (A) wild type (WT) and (C) notchst51/st51 mutants were largely devoid of AO-positive cells at 52 hpf. In contrast, AO-positive cells were abundant in the hindbrain region of (B) notch3 heterozygotes. (D–I) Dorsal views of deltaD expression. (D,G) In wild type, deltaD mRNA was abundant in the CNS. deltaD expression was more pronounced in (E) notch3st51/+ and (H) notch3zm/+ heterozygotes. deltaD expression was robust in lateral regions and showed gaps in medial regions (asterisks) of (F) notch3st51/st51 and (I) notch3zm/zm mutants. (J,K) Expression of another progenitor marker, gfap, which marks neural progenitor cells, was more robust in (K) notch3st51/+ heterozygotes compared with in (J) wild type. (L) In notch3st51/st51 mutants, gfap was present in lateral regions and showed medial gaps (asterisk). (M–O) HuC/D, a marker of post-mitotic neurons, expression was comparable in (M) wild type and (N) notch3st51/+ heterozygotes, but was more robust in the medial hindbrain (arrow) of notch3st51/st51 mutants. (P-R) Acetylated-tubulin-labeled (P) wild-type (n=5), (Q) notch3zm/+ heterozygotes (n=11) and (R) notch3zm/zm mutant (n=9) larvae. (P-R) Max projections of confocal images. ov, otic vesicle. All panels are dorsal views, anterior (A) is to the left and posterior (P) is to the right. |
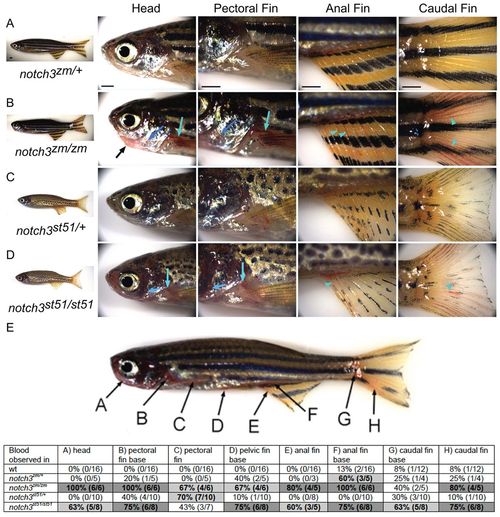
Vascular phenotype of notch3 mutants. (A–D) Lateral views of (A) notch3zm/+ heterozygotes, (B) notch3zm/zm mutants, (C) notch3st51/+ heterozygotes and (D) notch3st51/st51 mutants. (B) notch3zm/zm mutant adults show craniofacial defects (black arrow) and accumulation of blood (light and dark blue arrows and arrowheads) in the head, pectoral anal and caudal fins. (E) Quantification of the bleeding phenotypes. Degree of shading indicates penetrance of phenotype: white cell in the table indicates less than 50% of animals showed the phenotype, light gray indicates that 50–75% of individuals were affected, and dark gray denotes greater than 75% of animals had the phenotype. PHENOTYPE:
|
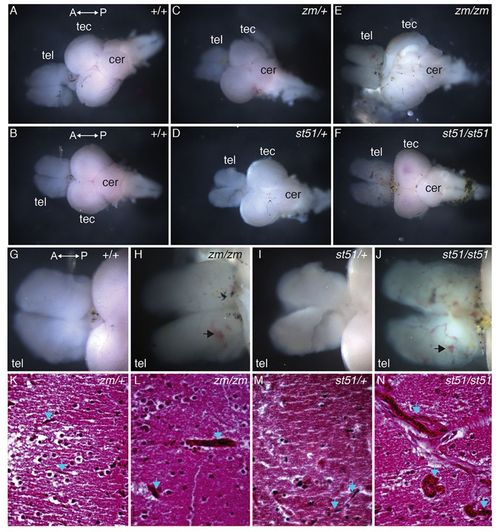
Vessels are more prominent in the telencephalon of notch3 mutants compared with wild type. (A–F) Overview images of dissected adult brains. (G–J) High-magnification images of the telencephalon. Compared with (A,B,G) wild-type and (C,D,I) heterozygous genotypes, vessels are more prominent in the telencephalon of (E,H) notch3zm/zm and (F,J) notch3st51/st51 mutants. (G–J) Large vessels and accumulation of blood (arrows) are apparent in mutant telencephalons. (K–N) H&E-stained sections of the medial telencephalon of (K) notch3zm/+, (L) notch3zm/zm, (M) notch3st51/+ and (N) notch3st51/st51 mutants. Small vessels traverse the tissue in heterozygotes, whereas large dilated vessels are present in homozygous mutant telencephalon. Blue arrows denote vessels. tel, telencephalon; tec, tectum; cer, cerebellum. The orientation of the anterior (A) and posterior (P) axis is indicated. (K–N) Scale bars: 20 μm. PHENOTYPE:
|
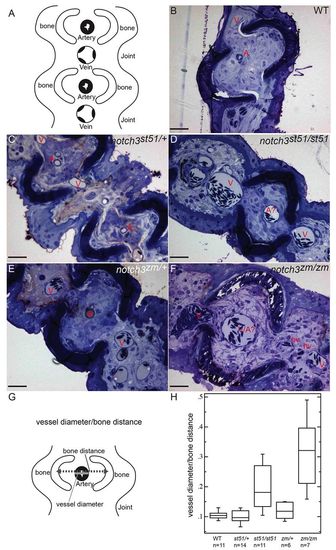
Distension of vessels in notch3 mutants. (A) Schematic depicting cross-section and the ordered arrangement of arteries within the bony regions and larger caliber veins within the joints of the fin rays observed in (B) wild type, (C) notch3st51/+ and (E) notch3zm/+ heterozygotes. This pattern is moderately disrupted in (D) notch3st51/st51 mutants and severely disrupted in (F) notch3zm/zm mutants. (B–F) Toluidine-blue-stained sections. Scale bars: 50 μm. A, artery; A?, probable artery based on position; V, vein; hv, hemorrhaged vessel. (G) Schematic depicting the strategy for quantification of vessel defects (detailed in the Materials and Methods). (H) Box plot of results reveals significantly larger vessels within the bony segments of the fin of notch3 mutants compared with wild-type adults. ANOVA results: mean squares between=6.7821×10²; mean squares error=3.4565×10³; P<0.0001. PHENOTYPE:
|
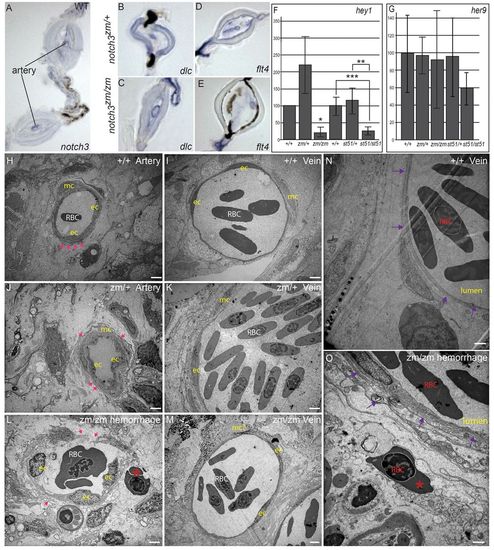
Expression of notch3, Notch targets, and arterial and venous markers in adult fin, and analysis of compromised vessel integrity and hemorrhage of vessels in notch3 mutants. (A) Consistent with the vascular phenotypes of notch3 mutants, we detected notch3 expression in association within arteries of adult wild-type (WT) fin. (B) deltaC is expressed in the arteries within the bony segments, but not in the veins, which are located in the joints of notch3zm/+ heterozygotes fins as expected. (C) In notch3zm/zm mutants, deltaC is also expressed in the enlarged vessels (note the enlarged lumen) within bony segments but not in the veins; thus, arterial and venous identity does not require notch3. (D,E) No difference in the pattern of flt4 expression between (D) notch3zm/+ heterozygotes and (E) notch3zm/zm mutant fins was detected, although the mutant vessels were distended. (F,G) qRT-PCR of Notch target expression in caudal fin. (F) qRT-PCR hey1. (G) qRT-PCR her9. y-axis indicates % of expression normalized to WT. (H–O) TEM analysis. (H) Wild-type artery. Pink arrows indicate dense plaques. (I) Wild-type vein. (J) Intact dense plaques surrounded arteries of notch3zm/+ heterozygotes and (K) veins show normal morphology, but appear slightly enlarged. (L) Breaks in the walls and reduced dense plaques (pink arrows) of notch3zm/zm mutant vessels with features reminiscent of arteries. Blood cells (red asterisk) are located outside of the damaged vessel. (M) notch3zm/zm mutant veins are comparable to those of notch3zm/+ heterozygotes. (N) Wild-type vein. The purple arrows in N and O indicate the vessel wall. (O) Hemorrhage and inflammation of notch3zm/zm vessel. Note the red blood cell (red asterisk in O) outside of the compromised vessel wall indicated by purple arrows. Scale bars: 1 μm. ec, endothelial cell; mc, vascular mural cells; RBC, red blood cell. *n=2; **P=0.06; ***P=0.02. |
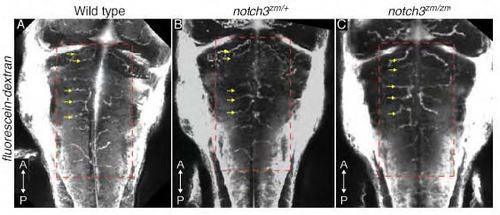
Microangiography of the vasculature in notch3 mutants. Images of Fluorescein-dextran labeled vasculature of 60-63 hpf A) wild type (n=2), B) notch3zm/+ (n=10) and C) notch3zm/zm (n=6) larvae reveals comparable patterning of the hindbrain vessels at the anatomical level (compare red dashed boxed areas). Yellow arrows indicate the Central arteries (CtAs). Images are max projections of dorsal views. |
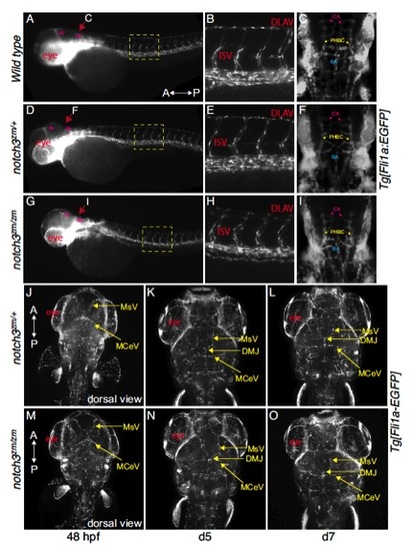
Tg[fli1a:EGFP] labelled vasculature of A,B,C) wild-type, D,E,F) notch3zm/+, G,H,I) notch3zm/zm were indistinguishable. A-I) 52hpf. A,B,D,E,G,H) Lateral views; max projection images. Dorsal is to the top and the Anterior (A) and posterior (P) axis is as indicated. A,D,G) The yellow dashed boxes correspond to the regions shown in the higher magnifications in B,E,H. C,F,I and J-O) Dorsal views; max projection images of Tg[fli1a:EGFP] labelled vasculature system of C) wild type F, J-L) notch3zm/+ heterozygotes and I, M-O) notch3zm/zm mutants. Vessel pattern at the anatomical level is intact in notch3zm/zm mutants (48hpf=9 hets and 6 mutants; day 5=2 hets, 3 mutants; day 7 = 3 WT, 6 hets, 2 mutants). The orientation of the Anterior (A) and posterior (P) axis is indicated. DLAV indicates the Dorsal Longitudinal Anastomotic Vessel; ISV denotes the InterSegmental Vessels; CA indicates the central artery; PHBC denotes the primordial hindbrain channel; BA indicates the Basilar artery; MsV indicates the Mesencephalic Vein; DMJ denotes the Dorsal Midline Junction; MCeV indicates the Mid-Cerebral Vein. |
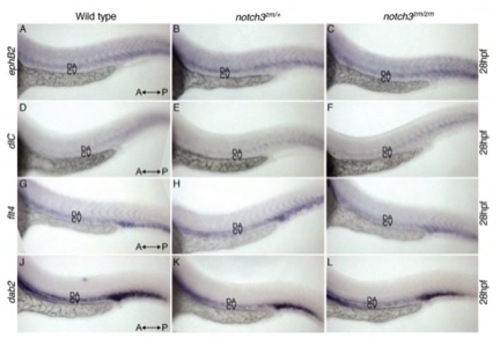
Expression of arterial and venous markers in notch3 mutant larvae. Patterns of the arterial marker, A-C) (efnb2a: 3 wt, 9 hets, 4 mutants), D-F) deltaC (dlc: 1 wt, 8 hets, 6 mutants) and venous, G-I) fms-related tyrosine kinase 4 (flt4: 2 wt, 10 hets, 2 mutants) and J-L) disabled homolog 2 (dab2: 2 wt, 9 hets, 3 mutants) expression were indistinguishable between A,D,G,J) wild-type, B,E,H,K) notch3zm/+ and C,F,I,L) notch3zm/zm mutants at 28 hpf. A-L) Dorsal is to the top and the orientation of the Anterior (A) and posterior (P) axis is as indicated. DA denotes dorsal aorta, CV indicates the cardinal vein. |

Expression of notch1a in notch3 mutants. A) In wild-type and B) notch3st51/+heterozygotes, and C) notch3st51/st51 mutants notch1a transcripts were detected in the CNS, albeit with gaps in medial regions of notch3st51/st51 mutants (asterisks). All panels are dorsal views, anterior (A) is to the left and posterior (P) is to the right. |
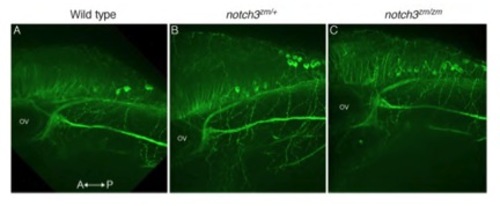
Axonal projections are intact in notch3 mutants. Acetylated tubulin labeled axon tracts were comparable between A) Wild-type (n=4), B) notch3zm/+heterozygotes (n=12), and C) notch3zm/zm mutant (n=7) larvae. Max projections of confocal images. Axes are as indicated. Ov denotes the otic vesicle. |