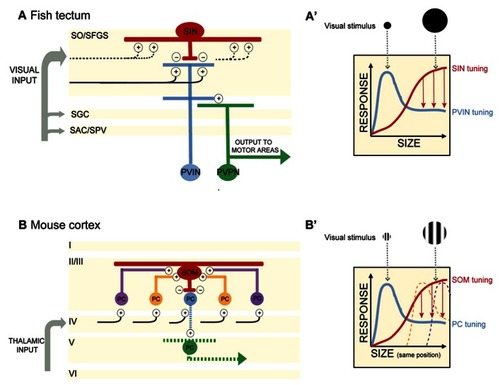
(A) In the optic tectum of the zebrafish larva, superficial interneurons (SINs) are preferentially tuned to large objects in the visual field. Periventricular neurons (PVNs) with dendrites stratifying in the deep neuropil are preferentially tuned to small objects. PVINs denote periventricular interneurons, PVPNs, periventricular projection neurons. Retinal inputs distribute among four main layers of the tectum (SO, stratum opticum; SFGS, stratum fibrosum et griseum superficiale; SGC, stratum griseum centrale; SAC/SPV, stratum album centrale/stratum periventriculare). SIN cell bodies are located in the SO and extend dendritic and axonal arbors throughout the SFGS. SINs may receive excitatory synaptic input directly from retinal ganglion cell axons or from PVINs or both. Plus and negative signs denote excitatory and inhibitory connections, respectively. Blue and red indicate excitatory and inhibitory interneurons, respectively. Projection neurons are colored in green. Black lines depict retinal ganglion cell axons. Dashed lines indicate predicted, but not yet demonstrated synaptic connections. (A′) Schematic of SIN filtering in the optic tectum. As the size of the visual stimulus increases, SINs become activated and provide inhibitory input to sharpen the tuning of PVIN receptive fields. Size-tuning curves for SINs and PVINs are depicted by red and blue curves, respectively. Red arrows denote inhibition acting to sharpen tuning. (B) In the mouse visual cortex, somatostatin-expressing interneurons (SOMs) are preferentially tuned to large objects in the visual field and display no surround suppression. SOMs are positioned in layer II/III and receive lateral excitatory inputs from pyramidal cells (PCs) in layer II/III. SOMs provide inhibition to neighboring layer II/III PCs, resulting in surround suppression and PC preferential tuning to smaller objects. Cortical layers I to VI are denoted. Plus and negative signs denote excitatory and inhibitory connections, respectively. Red denotes inhibitory interneurons. Excitatory PCs in layer II/III are colored in blue, orange, and purple (corresponding to their relative distance from the SOM). The central PC (shown in blue) receives surround suppression from the SOM. PCs in layer V are colored in green. For simplicity in this schematic, only connections pertaining to size filtering circuitry are shown. Projections of layer II/III PCs are not shown. Black lines depict input from the thalamus. Dashed lines indicate predicted, but not yet demonstrated synaptic connections. (B′) Schematic of SOM filtering in the visual cortex. Here the visual stimulus is a drifting grating (within a circular aperture) of increasing size. Size tuning of the central PC shown in (B; blue) is depicted here with a blue size-tuning curve. As the stimulus size increases beyond the size of the blue PC’s receptive field, the receptive fields of neighboring PCs are activated. The large visual stimulus occupies the same position in the visual field as the small stimulus, but increases in diameter thus encompassing multiple PC receptive fields (depicted here by the orange and purple size-tuning curves). These PCs provide excitatory drive to a SOM. SOM activation in turn provides surround suppression to the blue PC. The size-tuning curve of the SOM is depicted in red. Red arrows denote inhibition acting to sharpen tuning.
|
