
- Title
-
FishFace: interactive atlas of zebrafish craniofacial development at cellular resolution
- Authors
- Eames, B.F., Delaurier, A., Ullmann, B., Huycke, T.R., Nichols, J.T., Dowd, J., McFadden, M., Sasaki, M.M., and Kimmel, C.B.
- Source
- Full text @ BMC Dev. Biol.
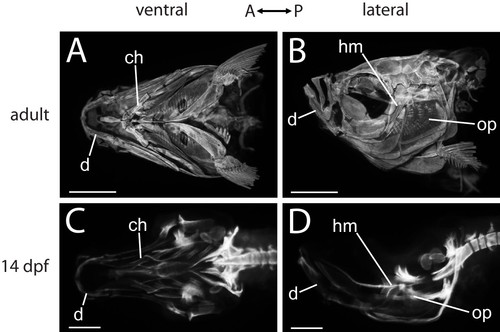
OPT data provide an overview of zebrafish craniofacial skeletal anatomy. Ventral (A, C) and lateral (B, D) views of zebrafish heads from OPT data demonstrate the decrease in complexity of skeletal elements when earlier specimens are compared with older specimens. While the adult head is covered by bones (A, B), only a small number of ossifications are visible in the ventral region of the 14 dpf zebrafish craniofacial skeleton (C, D). Representative skeletal elements are indicated. Abbreviations: A = anterior; ch = ceratohyal; d = dentary; dpf = days post-fertilization; hm = hyomandibula; op = opercle; P = posterior. Scale bars: A,B = 1 mm; C,D = 200 μm. |
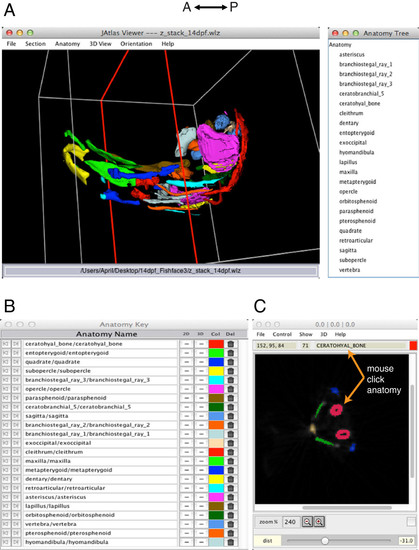
Skeletal anatomy of the zebrafish head at 14 dpf visualized using Jatlas Viewer. The interactive 3D model of skeletal structures (A) can be rotated in a user-defined fashion with a click and drag of the mouse. The Anatomy Tree (right) lists all of the structures displayed in the 3D view. The Anatomy Key (B) shows the name of each structure in the 3D model and its color code. Structures can be switched on and off in the 2D and 3D viewer windows by clicking on "+/-" in the 2D and 3D columns of the Anatomy Key. Structures can be removed and replaced from the 3D and 2D viewers by clicking on the icon in the Del column. Colors can be changed by clicking in the Col column, which opens a palette of colors to choose from. In the 2D section view (C), structures shown in the 3D viewer are displayed in the same colors. With the ′mouse-click anatomy′ function, users can use their mouse to click structures on the 2D section, and the name appears at the top of the 2D viewer window. The plane of section is shown as a red outline in the 3D model (A), and can be changed by adjusting ′yaw′ and ′pitch′. |
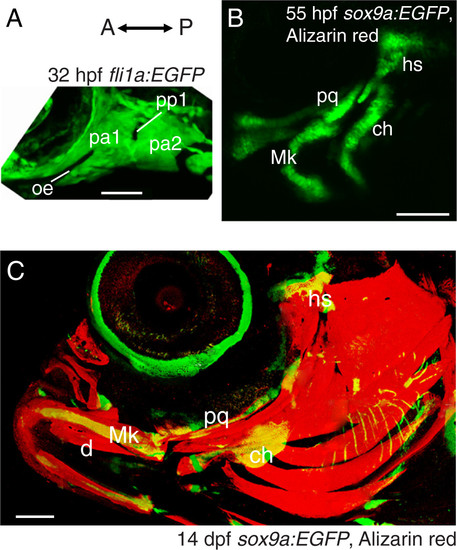
Low magnification confocal images demonstrate dynamics of morphology and complexity during zebrafish craniofacial development. Lateral view of fli1a:EGFP zebrafish at 32 hpf (A) illustrates apparent simple and homogenous arrangement of cells in the anterior two pharyngeal arches. Lateral view of Alizarin red-stained sox9a:EGFP zebrafish at 55 hpf (B) demonstrates that most cartilages, including dorsal and ventral elements, have begun to form in these pharyngeal arches, while no bones are visible. Compared to 55 hpf, Alizarin red-stained sox9a:EGFP zebrafish by 14 dpf (C) show that cartilage elements have changed in morphology and size, but the addition of many bones results in a major increase in complexity. Abbreviations: A= anterior; ch = ceratohyal; d = dentary; dpf = days post-fertilization; hpf = hours post-fertilization; hs = hyosymplectic; Mk = Meckel’s cartilage; oe = oral ectoderm; P = posterior; pa = pharyngeal arch; pp = pharyngeal pouch; pq = palatoquadrate. Scale bars: A = 50 μm; B = 100 μm; C = 200 μm. |
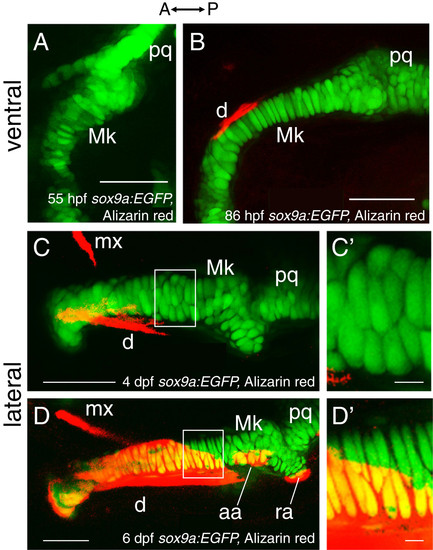
Chondrocyte intercalation and proliferation seem to drive cartilage growth in late embryonic and early larval stages. Confocal images in ventral view of Alizarin red-stained sox9a:EGFP mandibles suggest that early phases of Meckel’s cartilage morphogenesis may be achieved by chondrocyte intercalation. By 55 hpf (A), chondrocytes in Meckel’s cartilage do not appear in ordered rows, as generally two to three cells span the mediolateral width of the element. By 86 hpf (B), Meckel’s cartilage has grown in length and is relatively thinner from that seen at 55 hpf, and many of its chondrocytes now span the mediolateral width in a cellular stack. Confocal images in lateral view of Alizarin red-stained sox9a:EGFP mandibles suggest that later phases of Meckel’s cartilage morphogenesis may be achieved by chondrocyte proliferation. Chondrocytes of Meckel’s cartilage are separated clearly from each other by 4 dpf (C). By 6 dpf, proliferation of chondrocytes about mid-way along the anterior-posterior length of Meckel’s cartilage (D) is suggested by the presence of chondrocyte doublets. These doublets are separated from each other by a layer of presumed extracellular matrix that appears much thinner than that observed between the doublets. C′ and D′ show high magnification views of the boxed regions in C and D, respectively. Abbreviations: A = anterior; aa = anguloarticular; d = dentary; dpf = days post-fertilization; hpf = hours post-fertilization; Mk = Meckel’s cartilage; mx = maxilla; P = posterior; pq = palatoquadrate; ra = retroarticular. Scale bars: A-D = 50 μm; C′,D′ = 5 μm. |
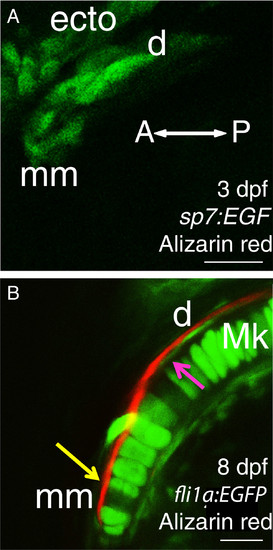
Cellular resolution of bones in the anterior Meckel′s cartilage suggests that the dentary has fused with the mentomeckelian bone from the earliest stages of osteogenesis. Before bone matrix is detected by Alizarin red, only one group of osteoblasts is apparent adjacent to Meckel’s cartilage in 3 dpf Alizarin red-stained sp7:EGFP larvae from a ventral view (A). In a confocal slice of the anterior region of Meckel’s cartilage in 8 dpf Alizarin red-stained fli1a: EGFP larvae (B), a single bone is visible from a ventral view, but its association with chondrocytes of Meckel’s cartilage appears to vary anteroposteriorly. Anteriorly, bone lies immediately adjacent to chondrocytes (yellow arrow), while more posteriorly, the bone appears to be separated from chondrocytes by cells of the presumptive perichondrium (magenta arrow). Abbreviations: A = anterior; d = dentary; dpf = days post-fertilization; ecto = ectoderm; Mk = Meckel’s cartilage; mm = mentomeckelian; P = posterior. Scale bars: A,B = 20 μm. |
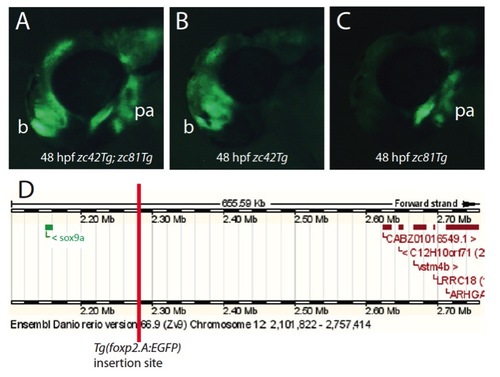
Fluorescent images (A-C) of lateral views of 48 hours post fertilization Tg(foxp2.A:EGFP)zc42 embryos demonstrate the isolation of a novel transgenic insertion, resulting in the sox9a:EGFP expression domain. The initial stable line of Tg(foxp2.A:EGFP)zc42 had two expression domains: brain and pharyngeal arches (A). These two domains independently segregated in offspring (B,C). Using inverse PCR, the genomic location of the insertion site of the pharyngeal arch expression domain was identified as being approximately 120kb upstream of the sox9a transcriptional start site in a 400kb stretch of the genome devoid of known genes (D). The official name of this transgenic line is sox9azc81Tg, which we refer to as zc81Tg in the atlas, and for clarity in this paper sox9a:EGFP Abbreviations: b=brain; pa=pharyngeal arches. |