
- Title
-
The Histone Methyltransferase SUV39H1 Suppresses Embryonal Rhabdomyosarcoma Formation in Zebrafish
- Authors
- Albacker, C.E., Storer, N.Y., Langdon, E.M., Dibiase, A., Zhou, Y., Langenau, D.M., and Zon, L.I.
- Source
- Full text @ PLoS One
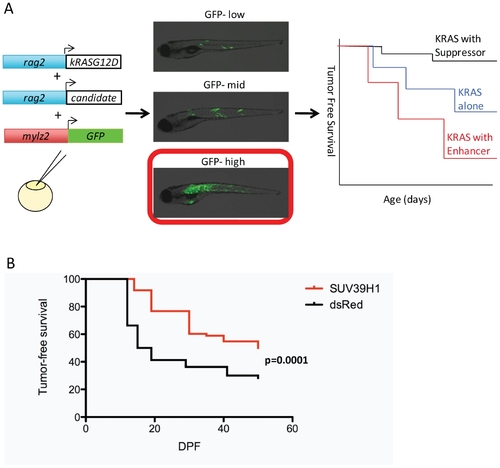
An overexpression screen reveals SUV39H1 as a suppressor of rhabdomyosarcoma formation in zebrafish. (A) Three linearized DNA constructs were injected into one-cell stage embryos, rag2-hKRASG12D, rag2-chromatin factor, and mylz2-GFP. At 2 dpf, embryos were scored for GFP mosaicism; only those that were GFP-high were kept for tumor evaluation. Tumor-free survival curves were then constructed for days 12–50 of life, looking for enhancers or suppressors of tumor formation compared to control injected zebrafish with rag2-hKRASG12D without a modifier gene. (B) SUV39H1 significantly suppressed RMS formation, compared to a control curve where the modifier gene was dsRed (SUV39H1 n = 73, dsRed n = 80, p = 0.0001). |
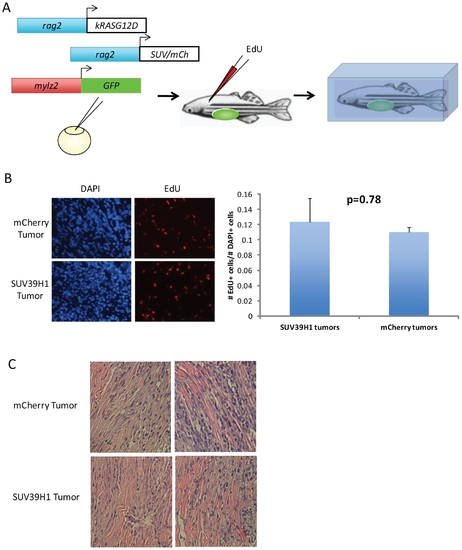
SUV39H1 overexpression does not impact cell cycle or muscle differentiation status of mature tumors. (A) Experimental design for in vivo cell cycle analysis. One-cell stage embryos were injected with three constructs rag2-hKRASG12D, either rag2-mCherry or rag2-hSUV39H1, and mylz2-GFP. High-GFP expressing fish were raised to 30 dpf, and those with tumors were injected IP with EdU. After 24 hours, the injected fish were sacrificed and cryopreserved. (B) Number of EdU-positive cells, stained on GFP-positive tumor sections, was normalized to number of total cells, determined by presence of DAPI. No difference was observed between the control and SUV39H1 tumors (n = 5 for each group; p = 0.78). (C) H&E staining of RMS tumors overexpression either mCherry or SUV39H1. Both sets of tumors are very poorly differentiated; they also look similar to each other, indicating no difference in differentiation state of the tumors (bars represent 50 um, n = 6 for each group). |
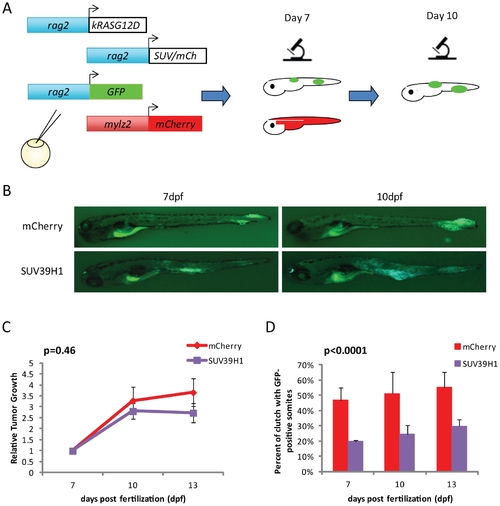
SUV39H1 impacts the initiation, not the growth rate, of the tumors. (A) Experimental design to view the tumors in larval stages by fluorescence. Four constructs are injected into one cell stage embryos, rag2-hKRASG12D, rag2-hSUV39H1 or control rag2-mCherry, rag2-GFP, and mylz2-mCherry. Fish highly mosaicism for mylz2-mCherry expression are analyzed on day 7 for presence of GFP, indicative of developing tumors. Analysis is also performed on day 10 to note tumor growth. (B) Representative images of 7 and 10 dpf larvae with GFP-positive cells in the musculature. There is visible growth between 7 and 10 dpf as they develop into tumors. (C) Tumor growth rates, relative to size of tumor on day 7. There is no significant difference between growth rates of the SUV39H1-overexpressing tumors compared to control tumors (SUV39H1 n = 22, mCherry n = 13, p = 0.46). (D) Percentage of larvae within a clutch that contain GFP-positive cells in the musculature. More fish in the mCherry clutches have developing tumors when compared to SUV39H1 clutches (SUV39H1 n = 200, mCherry n = 136, p<0.0001). |
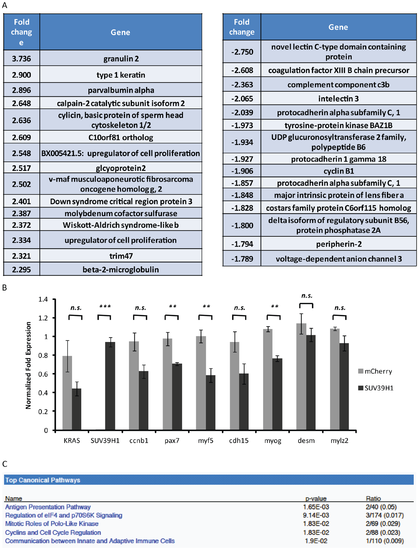
Global gene expression analysis reveals SUV39H1 may act through aberrant cell cycle regulation. (A) Table of top up- and downregulated annotated genes in rag2-KRASG12D, rag2-SUV39H1 7 dpf larvae as compared to rag2-KRASG12D, rag2-mCherry control larvae. Of particular interest was cyclin B1. (B) Gene expression analysis by qPCR in rag2-KRASG12D, rag2-SUV39H1 7 dpf larvae as compared to rag2-KRASG12D, rag2-mCherry control larvae, all mylz2-GFP positive. Cyclin B1 downregulation was approaching significance, confirming the microarray analysis (p = 0.0553). As expected, SUV39H1 levels differ between the larvae, but KRAS levels do not, suggesting SUV39H1 is not simply downregulating KRAS to suppress tumor formation (SUV39H1 p<0.0001; KRAS p = 0.1284). SUV39H1 may also have an impact on some muscle differentiation genes at this stage of tumor development (pax7 p = 0.0230; myf5 p = 0.0143; cdh15 p = 0.0922; myog p = 0.0017; desm p = 0.4098; mylz2 p = 0.1311). (C) Ingenuity Pathway Analysis of top canonical pathways affected based on the 7 dpf microarray list. Of the top five pathways impacted, two involve cell cycle regulators. |
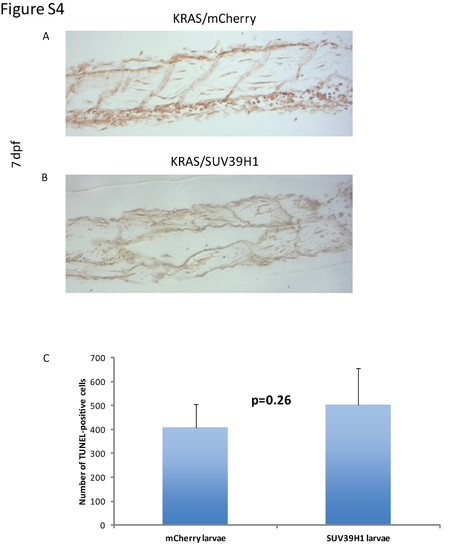
SUV39H1 overexpression does not lead to increased apoptosis. (A) TUNEL staining of rag2-hKRASG12D, rag2-mCherry, and mylz2-mCherry-positive 7 dpf fish (20×). (B) Similar levels of cell death are seen in rag2-hKRASG12D, rag2-hSUV39H1, and mylz2-mCherry-positive 7 dpf fish, as noted by TUNEL staining (20×). (C) Average number of TUNEL-positive cells over two separate fields of musculature per larvae (n = 5 for each). This result reveals that there is not increased apoptosis in the SUV39H1-overexpressing larvae, suggesting the tumor initiating cells are not simply dying off (p = 0.26). |