
- Title
-
Late Recruitment of Synapsin to Nascent Synapses Is Regulated by Cdk5
- Authors
- Easley-Neal, C., Fierro, J., Buchanan, J., and Washbourne, P.
- Source
- Full text @ Cell Rep.
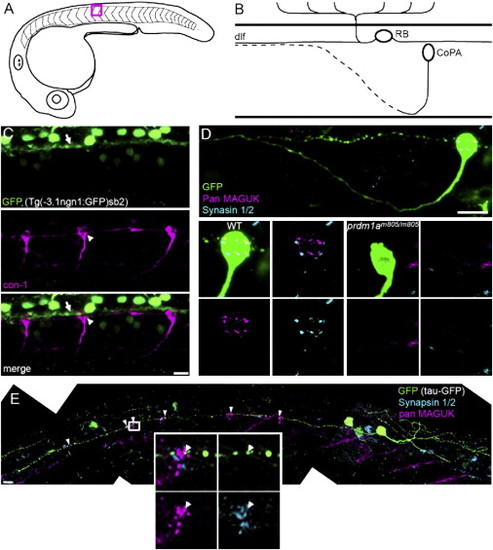
RBs Synapse onto CoPA Interneurons (A) Diagram of a lateral view of a 25 hpf zebrafish embryo. Studies were performed between segments 11 and 15. Red box outlines segment 12, the region represented in (B). (B) Diagram depicting the cell body location and axon trajectories of an RB cell and a CoPA cell, in a lateral view of the developing spinal cord. The dotted axon represents a contralateral projection. (C) CoPA cell bodies (white arrowhead), labeled with con-1 antibody (magenta), were in close proximity to RB axons expressing GFP (white arrow), in ngn1:GFP transgenic embryos. Scale bar represents 10 μm. (D) pan MAGUK (magenta) and synapsin 1/2 (cyan) immunolabeling on WT and prdmm805/m805 embryos with Tau-GFP-labeled CoPA cells. Top panel: shows axon projections and cell body of a CoPA cell in WT embryo. The cell body is shown at higher magnification in bottom left 4 panels, to highlight overlap of pre and postsynaptic puncta. Lower right four panels: no pre- or postsynaptic puncta were seen on CoPA cell bodies in prdmm805/m805 embryos, lacking RB cells. Scale bar represents 10 μm. (E) Composite image of a RB cell expressing GFP (green), including the entire central axon extending rostrally, with labeling for synapsin 1/2 (cyan) and pan MAGUK (magenta). Distinct clusters of colocalized pan MAGUK and synapsin 1/2 immunofluorescence were at CoPA cell bodies, see arrowheads. Inset shows distinct MAGUK and synapsin 1/2 puncta, arrowhead indicates a MAGUK puncta adjacent to a synapsin 1/2 puncta that is within a varicosity in the GFP-expressing RB axon. Scale bar represents 10 μm. See also Movie S1. |
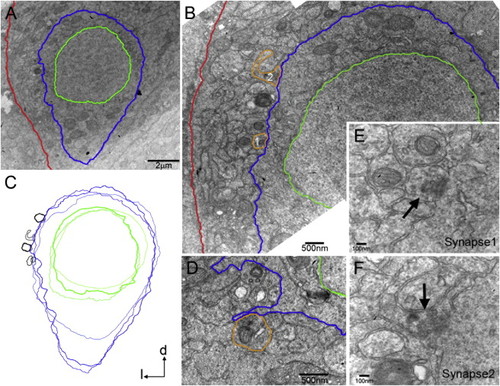
Axosomatic Synapses on CoPA-Like Cells (A) Electron micrograph of a transverse section of the zebrafish embryo at 28 hpf. CoPA-like cells were identified based on their cell body shape and dorso-lateral location in the spinal cord. The plasma membrane and nuclear envelope were traced in blue and green for clarity, respectively. The basal lamina of the spinal cord is in red. (B) Synapses (orange tracing) from axons in the dlf were identified on the CoPA-like cell body in (A) (see E and F for higher magnification). (C) Synapses were found on the lateral face of CoPA-like cells in a stereotypical location, as demonstrated by an overlay of three cell profiles with their synapses (black). (D) At 25 hpf, synapses were located on small filopodial extensions from the cell body. (E and F) Higher magnification images of synapse1 (E) and synapse2 (F) in (B), with accumulations of synaptic vesicles (arrows), smooth apposed synaptic membranes and weakly labeled postsynaptic densities. |
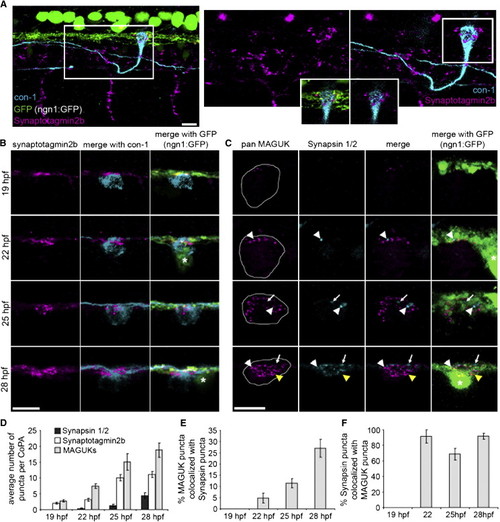
Presynaptic Components Arrive Sequentially during Development (A) Left panel: lateral view of three segments of a 25 hpf embryo expressing ngn1:GFP (green) labeled with antibodies to synaptotagmin2b (magenta) and CoPA neurons (con-1, cyan). Notice synaptotagmin2b puncta were colocalized with CoPA cell bodies at the dlf. Right panels: zoom of box in left panel. Inset shows single plane of boxed region at the level of the dlf and the contacting region of the CoPA cell. Scale bar represents 10 μm. (B) Dorsal view of IF labeling for synaptotagmin2b (magenta) colocalized with CoPA cell bodies (cyan) in ngn1:GFP embryos from 1–28 hpf. Asterisk labels RB cell bodies. Scale bar represents 10 μm. (C) Dorsal view of IF labeling for MAGUKs (magenta) and synapsin 1/2 (cyan) from 19–28 hpf. Asterisk labels RB cell bodies. White arrowheads show sites of colocalization of synapsins and MAGUKs, white arrows indicate localization of synapsins only, and yellow arrowheads indicate localization of MAGUKs only. Outlines of CoPA cell bodies were generated by increasing the gain of the MAGUK IF. Scale bar represents 10 μm. (D) Histogram shows the number of synapsin 1/2, synaptotagmin2b, and MAGUK puncta per CoPA cell from 19–28 hpf. (E and F) Histograms show the percentage of MAGUK puncta colocalized with synapsin puncta, and the percentage of synapsin puncta colocalized with MAGUK puncta, respectively, from 19–28 hpf. Error bars show SEM. See also Figure S1 and Table S1. |
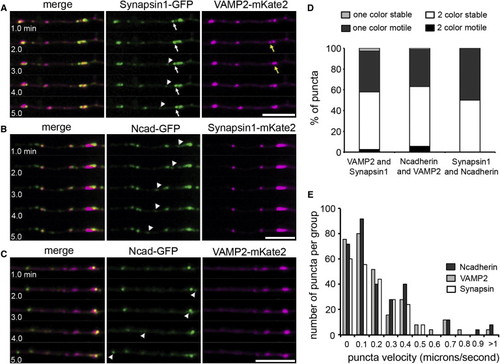
Synapsin1, STVs, and PTVs Are Transported Independently of Each Other (A–C) Selected sequence of five frames, 1 min apart, from 30 min time-lapse movies showing differential transport of synapsin1-GFP and VAMP2-mKate2 (A), synapsin1-mKate2 and N-cadherin-GFP (B), and N-cadherin-GFP and VAMP2-mKate2 (C) in RB axons. Movies acquired between 24–26 hpf. Arrows and arrowheads highlight motile puncta that were positive for only one of the two fluorescent fusion proteins. A VAMP2-mKate punctum was initially paused (yellow arrow in A) and colocalized with a synapsin1-GFP punctum (white arrow), but then moved away (t = 3.0). Scale bars represent 10 μm. (D) Histogram showing the number of two color puncta versus single color puncta that are motile over a 30 min imaging period. Two color puncta are those labeled for both transport packet markers imaged in a given pair, single color puncta are those expressing only one of the two markers. Error bars represent SEM. p < 0.005.(E) Distribution of the number of each type of puncta (N-cadherin, VAMP2, synapsin) at each velocity. The maximum velocity measured for a synapsin1 puncta was 2.49- and 1.98-fold slower than the maximum velocity for an N-cadherin or a VAMP2 puncta, respectively. See also Figure S2 and Movie S2. |
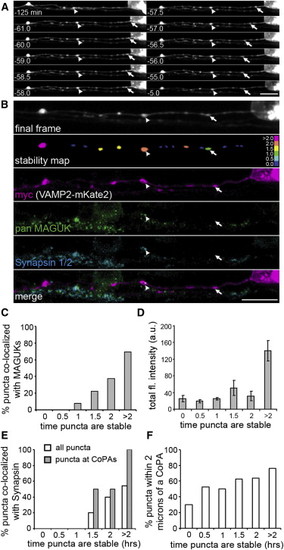
Delayed Synapsin Recruitment to Paused VAMP2-mKate2 Puncta (A) Selected frames from a 2 hr time-lapse movie (from 24–26 hpf) of VAMP2-mKate2 expressed by a RB cell. Although some puncta remained stable for the entire imaging period (arrowheads) others stabilized during imaging (arrow). Scale bar represents 10 μm. (B) Postimaging IF labeling demonstrates the presence of MAGUKs (green) at a VAMP2-mKate2 punctum that was paused for at least 2 hr (arrowhead), but not at a punctum paused for 29 min (arrow). The stability map uses a color code to report the time each punctum was paused before the end of imaging. Bins were as follows: nonpaused puncta (0.0, dark blue), paused for 0–0.5 hr (0.5), 0.5–1 hr (1), etc. to puncta paused for the entire imaging period (>2.0, magenta). Scale bar represents 10 μm. (C) Stability histogram shows quantification of the percentage of VAMP2-mKate2 puncta colocalized with MAGUKs over the total of all axon segments analyzed. Bins are as described for the stability map above. n = 7 RB axon segments analyzed. (D) Intensity histogram shows the total fluorescence intensity for VAMP2 puncta. A significant increase in total fluorescence intensity was seen at puncta paused for >2 hr. Error bars show SEM. (E) A stability histogram quantifying the percentage of synapsin 1/2 that colocalized with VAMP2-mKate2 puncta reveals that, on average, recruitment of VAMP2-mKate2 preceded that of synapsin by 83.7 min (±12.5 min). n = 13 RB axon segments analyzed. (F) A stability histogram quantifying the percentage of VAMP2-mKate2 puncta that are localized within 2 μm of a CoPA cell. |
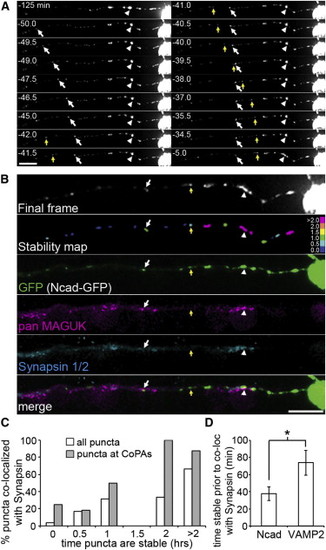
N-Cadherin Recruitment Precedes Synapsin (A) Selected frames from a 2 hr time-lapse movie (from 24–26 hpf) of Ncad-GFP expression in a RB cell. Some puncta were paused for the entire imaging period (arrowhead), whereas others paused during imaging (arrow). Scale bar represents 10 μm.(B) Postimaging IF labeling demonstrates the presence of synapsin 1/2 (cyan) and MAGUKs (magenta) at an N-cadherin-GFP (green) punctum that was paused for the entire imaging period (arrowhead) and for 34.5 min preceding the end of imaging (arrow), but not at a punctum that was paused for only 29.5 min preceding the final frame (yellow arrow). A stability map (with bins as described in Figure 5) reports the time each puncta was paused preceding the end of imaging. Scale bar represents 10 μm.(C) A stability histogram quantifying the percentage of synapsin 1/2 puncta that colocalized with N-cadherin-GFP (white bars) reveals that recruitment of N-cadherin precedes synapsin by 37.6 min (±8.0 min). Gray bars show data for VAMP2-mKate2 from histogram in Figure 5C to emphasize the difference in the time delay with which synapsin colocalization is first seen. Bins were as described for Figure 5.(D) Histogram quantifying the average amount of time (in min.) NCad and VAMP2 puncta were stable prior to the end of imaging and colocalized with synapsin. n = 13 RB axon segments analyzed. Error bars show SEM. p < 0.05. |
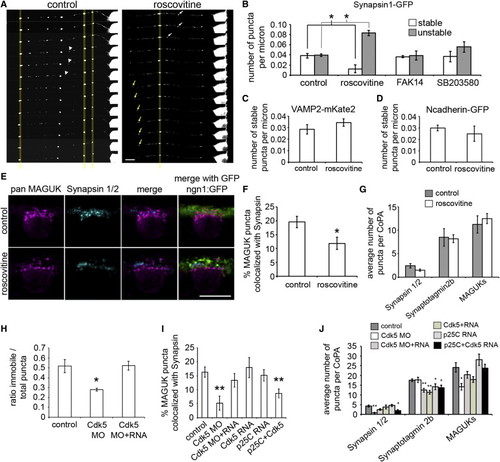
Cdk5 Regulates Synapsin Stabilization at Synapses (A) Selected frames from 1 hr time lapse movies of synapsin1-GFP expressing RB axons treated with either vehicle (control, left panel) or roscovitine (right panel). Scale bar represents 10 μm. (B) Histogram quantifying the number of stable and unstable puncta per micron for each treatment condition. (C and D) Histograms showing the number of stable puncta per micron in control and roscovitine treatment conditions in VAMP2-mKate2 expressing RB axons (C) and in N-cadherin-GFP expressing axons (D). (E) Dorsal view of IF labeling in 26 hpf ngn1:GFP (green) expressing embryos with antibodies for pan MAGUK (magenta) and synapsin 1/2 (cyan). Scale bar represents 10 μm.(F) Histogram showing the percentage of MAGUK puncta colocalized with synapsin puncta. (G) Histogram showing the average number of synapsin 1/2, synaptotagmin2b, and MAGUK puncta per CoPA cell for both control and roscovitine treatment conditions. (H) Histogram showing the ratio of stable to total synapsin1-GFP puncta in control, Cdk5 MO, and Cdk5 MO and RNA-injected embryos. (I) Histogram showing the percentage of MAGUK puncta colocalized with synapsin puncta in control, Cdk5 MO, Cdk5 MO and RNA, Cdk5 RNA, p25C RNA, and p25C and Cdk5 RNA-injected embryos. (J) Histogram showing the average number of synapsin 1/2, synaptotagmin2b, and MAGUK puncta for control, Cdk5 MO, Cdk5 MO and RNA, Cdk5 RNA, p25C RNA, and p25C and Cdk5 RNA-injected embryos. Error bars show SEM. p < 0.05 and p < 0.005 as compared to control condition. |
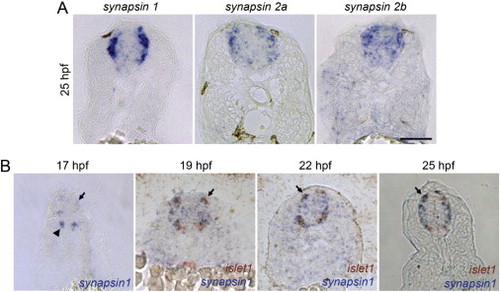
Zebrafish synapsin Genes Are Expressed in RBs, Related to Figure 3 (A) In situ hybridization (ISH) for zebrafish synapsins1, 2a, and 2b at 25 hpf in transverse sections. synapsin1 showed the strongest expression of the three in RBs. Scale bar 50 μm. (B) synapsin1 ISH on 17, 19, 22, and 25 hpf transverse sections (2 color ISH with islet-1 to label RBs and motor neurons in 19, 22, and 25 hpf images). synapsin1 transcript was first seen at 17 hpf in motor neuron domain (arrowhead), but not in RBs (arrow). synapsin1 and islet1 were seen in RBs from 19 hpf on (arrows). Scale bar 50 μm. |
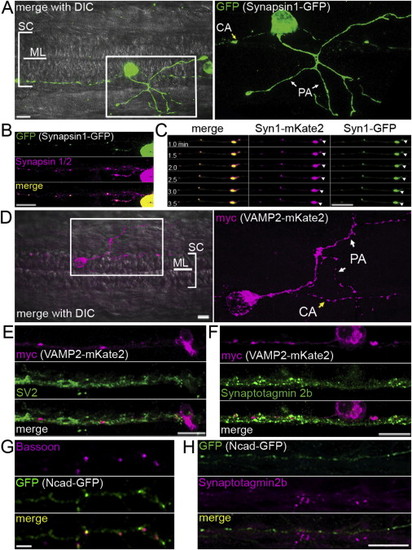
Validation of Fluorescently-Tagged Fusion Constructs, Related to Figure 4 (A) synapsin1-GFP in a RB neuron in the zebrafish spinal cord at 25 hpf. Left panel: Dorsal view of IF labeling of GFP overlayed with a brightfield image. The midline (ML) and extent of the spinal cord (SC) are indicated. Rostral is to the left. Right panel: enlargement of IF outlined in box showing synapsin1-GFP. PA: peripheral arbor, CA: central axon. Scale bar, 10 μm. (B) synapsin1-GFP was localized with a similar distribution as endogenous synapsin 1/2 in RB axons in the zebrafish spinal cord. (C) Selected sequence of 6 frames, 30 s apart, from a 30 min movie. Arrowheads highlight a moving punctum labeled with both synapsin1-GFP and synapsin1-mKate2. (D) A RB neuron expressing VAMP2-mKate2 at 25 hpf in a dorsal view. Left panel, IF for VAMP2-mKate2 overlayed on a bright field image. Right panel, magnification of myc IF labeling, showing the peripheral arbor (PA) and central axon (CA) of the RB. Scale bar, 10 μm. (E) IF labeling of SV2 was highly colocalized with VAMP2-mKate2 labeling. Scale bar 10 μm. (F) IF labeling of STV marker synaptotagmin2b was highly colocalized with VAMP2-mKate2. Scale bar 10 μm. (G) IF for bassoon on Ncad-GFP transfected rat hippocampal neurons shows that the majority of Bassoon puncta colocalized with Ncad-GFP puncta. (H) IF for synaptotagmin2b colocalized with only a small percentage of Ncad-GFP puncta. Scale bar 10 μm. |