
- Title
-
Mutations in ap1b1 Cause Mistargeting of the Na(+)/K(+)-ATPase Pump in Sensory Hair Cells
- Authors
- Grisham, R.C., Kindt, K., Finger-Baier, K., Schmid, B., and Nicolson, T.
- Source
- Full text @ PLoS One

Positional cloning of skylab mutations and expression of ap1b1. A, A diagram of the 330 kb skylab critical interval (striped region) obtained through mapping of the tm246a allele. The critical interval encompasses the coding regions of five annotated genes as well as part of two other genes. B, An exon diagram of the ap1b1 gene. The coding region is depicted in grey and the 52 and 32 UTRs are depicted in white. The locations of the t20325 C-T transition the tm246a 23 bp deletion between exons 8 and 9 are indicated. C, The nucleotides deleted from the splice acceptor site between exons 8 and 9 in the tm246a mutant are highlighted in red in the WT transcript. The resulting translations are shown above the WT and tm246a transcripts. D, Diagram showing the location of tm246a and t20325 mutations in the Ap1b1 protein. E, ap1b1 is expressed ubiquitously at 24 hpf. F, Sense control for ap1b1 in situ experiments. G, Expression of ap1b1 persists in the head at 48 hpf. Scale bars in E-G, 5 μm. H, I, Magnified images of the developing ear at 24 and 48 hpf, respectively. Scale bars in H and I, 10 μm. HB, hindbrain; OV, otic vesicle; AM, anterior macula; AC, anterior crista; LC lateral crista; PC, posterior crista. |
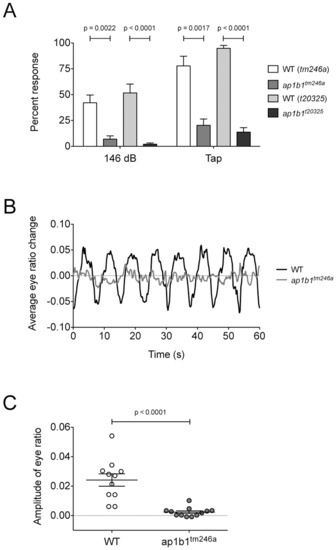
Figure 2. ap1b1 mutants have deficits in auditory and vestibular behavioral responses. A, Graph showing the average startle response to either a 1000Hz stimulus at 146 dB or a tap stimulus of both mutants (tm246a: n = 9, t20325: n = 23) and their WT siblings (tm246a: n = 15, t20325: n = 19). B, Averaged traces of vestibular-induced eye movements from WT siblings (n = 11) and tm246a mutants (n = 12) over 60 sec. C, Average of peak amplitude of vestibular-induced eye movements at 0.25 Hz. Each dot represents one eye from an individual larva at 5 dpf (WT: n = 11, tm246a: n = 12). A Mann-Whitney U-test was used to compare differences between mutants and WT siblings. PHENOTYPE:
|
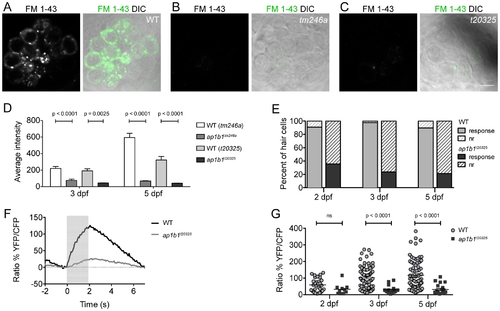
ap1b1 mutants have deficits in HC mechanotransduction. A–C, FM 1-43 label of neuromast HCs in WT, tm246a and t20325 mutants at 5 dpf. Scale bars, 5 µm. D, Average intensity (A.U.) of FM 1-43 label in tm246a and t20325 mutants quantified at 3 dpf (tm246a: WT n = 18, mutant n = 5; t20325: WT n = 16, mutant n = 8 neuromasts) and 5 dpf (tm246a: WT n = 9, mutant n = 10; t20325: WT n = 12, mutant n = 11 neuromasts) from at least 3 larvae along with WT, age-matched siblings. E, The proportion of HCs displaying calcium transients in response to a water-jet stimulus (solid) compared to those that do not respond (nr = non-responders, hatched lines). The percent of non-responding HCs in the t20325 mutants is greater than the percent non-responders in WT at all stages of development assayed; Chi Squared test, p<0.0001. F, Trace representing the average calcium responses to a 2 sec water-jet stimulus from 5 dpf WT and t20325 mutant larvae (n = 20 HCs). The grey box indicates the timing of the water-jet stimulus. G, Dot plot showing calcium transients in WT and t20325 larvae at 2, 3 and 5 dpf (non-responders were excluded). Each point represents an individual HC. Error bars represent SEM and statistical analysis was performed using a Mann-Whitney U-test. PHENOTYPE:
|
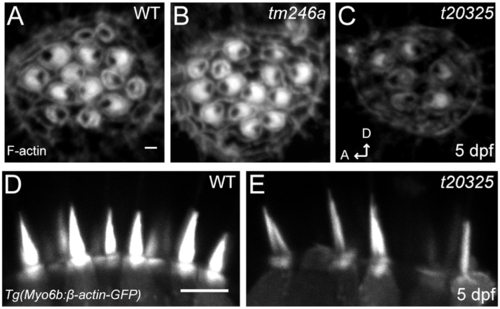
Stereociliary bundles of ap1b1 mutant. A–C, Representative confocal images of neuromast hair bundles in WT, tm246a and t20325 mutants at 5 dpf. Bundles were viewed from a top-down angle and actin was labeled with phalloidin-Alexa 488. This view shows the planar cell polarity of hair-bundles. Scale bar, 1 μm. D, E, Side view of stereocilia from the lateral cristae of 5 dpf WT and t20325 mutants in the Tg(myo6b:βactin-GFP) background (z-projections, 2 μm thick). Scale bar, 5 μm. |
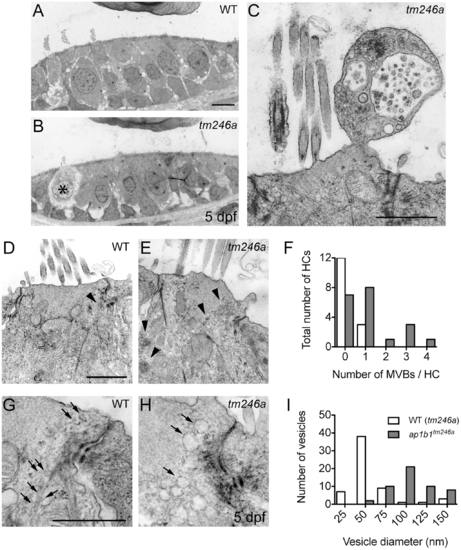
Decreased cell integrity and an increased number of intracellular membrane compartments in ap1b1 mutant HCs. A, B, Comparable sections of the anterior macula of WT and tm246a mutant at 5 dpf. An asterisk indicates a breakdown of cytoplasm in a tm246a mutant HC. Scale bars, 3 μm. C, Example of an apical bleb extruding from a mutant HC containing several vesicular compartments and a multivesicular body. Scale bar, 1 μm. D–E, Comparable close-ups of WT and tm246a mutant HCs just below the cuticular plate. Scale bar, 1 μm. In tm246a mutant HCs, more multivesicular bodies (arrowheads) were present compared to WT HCs. F, Quantification of the observed number of multivesicular bodies in WT sibling and tm246a mutant HCs. G–H, Sections of HCs near the tight junctions showing an increased number of large vesicles in the mutants compared to WT. Vesicles in WT are indicated with arrows. I, Observed sizes of vesicles in WT sibling and tm246a mutant HCs. For quantification in F and I, WT: n = 15, tm246a: n = 20 HCs. PHENOTYPE:
|
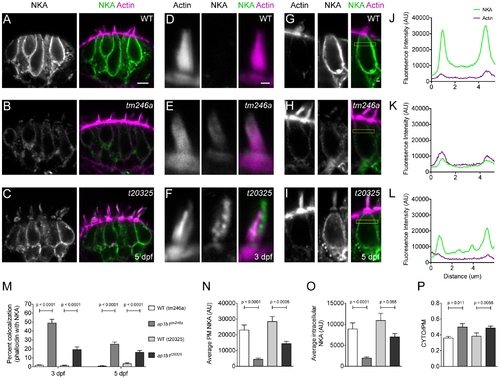
NKA is missorted to hair bundles in ap1b1 mutant HCs. A–C, NKA antibody label of the lateral crista of WT and tm246a and t20325 mutants at 5 dpf, respectively. Scale bar, 5 μm. D–F, Magnified examples of a single representative hair bundle in the cristae in WT, tm246a and t20325 mutants at 3 dpf. Scale bar, 1 μm. G–I, Representative HCs from which fluorescence profile plots were obtained. Yellow boxes indicate the region used for generating profile plots. Scale bar, 1 μm. J–L, Profile plots showing fluorescence intensity of the distribution of NKA immunolabel in WT and tm246a and t20325 mutant HCs shown in G, H and I, respectively. The green trace indicates NKA immunolabel and the magenta trace indicates phalloidin labeling. M, Quantification showing the average percent of NKA positive phalloidin pixels in WT and mutant stereocilia at both 3 (tm246a: WT n = 45, mutant n = 37; t20325: WT n = 39, mutant n = 53 bundles) and 5 dpf (tm246a: WT n = 46, mutant n = 72; t20325: WT n = 44, mutant n = 62 bundles) from e4 larvae. N, Quantification of NKA fluorescence (A.U.) at the membrane at 5 dpf. N, Quantification of intracellular NKA fluorescence (A.U.). O, Quantification of intracellular NKA fluorescence (A.U.) at 5 dpf. P, The ratio of intracellular NKA (CYTO) to plasma membrane localized NKA (PM). For N–P, tm246a: WT n = 19, mutant n = 16; t20325: WT n = 18, mutant n = 21 HCs. Error bars in M–P represent SEM and statistical difference determined with a Mann-Whitney U-test. |
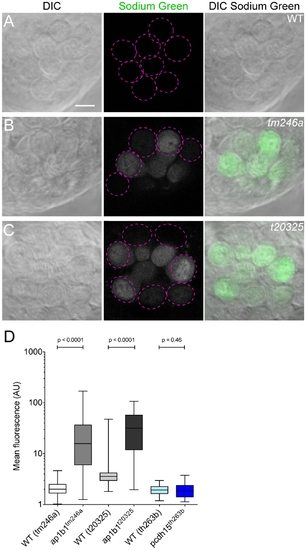
Increase of intracellular Na+ levels in mutant HCs. A–C, Sodium Green label in WT, tm246a and t20325 mutant neuromasts. Dotted magenta circles outline HCs that were used for quantification in that plane of view. Scale bar, 5 µm. D, Quantification of Sodium Green label in ap1b1 mutant, pcdh15th263b, and corresponding WT HCs. (tm246a: WT n = 124, mutant n = 90; t20325: WT n = 125, mutant n = 74; th263b: WT n = 100, mutant n = 84 HCs). Error bars represent SEM. Statistical analysis performed with a Mann-Whitney U-test. PHENOTYPE:
|