
- Title
-
Close Association of Carbonic Anhydrase (CA2a and CA15a), Na(+)/H(+) Exchanger (Nhe3b), and Ammonia Transporter Rhcg1 in Zebrafish Ionocytes Responsible for Na(+) Uptake
- Authors
- Ito, Y., Kobayashi, S., Nakamura, N., Miyagi, H., Esaki, M., Hoshijima, K., and Hirose, S.
- Source
- Full text @ Front. Physiol.
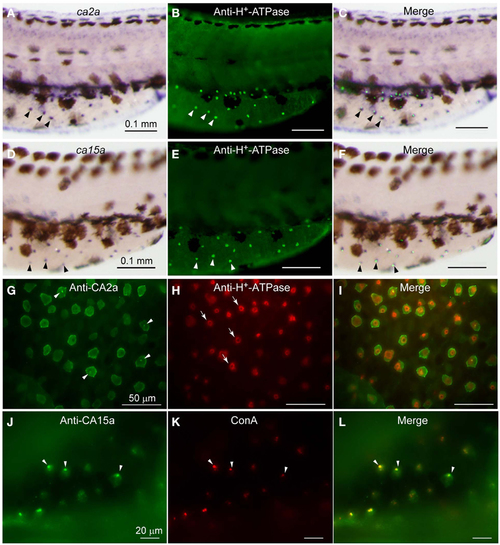
Expression of ca2a and ca15a mRNA and their protein products in H-MRC. Zebrafish larvae of 55-hpf were probed for expression of the indicated genes (A,D) and their products (G,J), and the types of positive cells were identified by costaining with anti-H+-ATPase (B,E,H) and concanavalin A [ConA, (K)], which are markers for H-MRC. Right panels (C,F,I,L) are merged images. All panels show lateral views of dorsal trunk and yolk sac extension of specimens oriented dorsal side up, anterior to the left. Large (30-50 µm) dendritic cells of dark brown in (A,C,D,F) are melanocytes. Arrowheads in (A-F) point to typical H-MRCs coexpressing ca2a, ca15a, and H+-ATPase. Arrowheads in (G,J-L) indicate the apical pits of H-MRC. Arrows in (H) show donut-like staining surrounding the pits. |
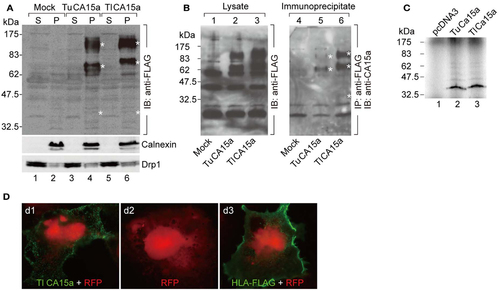
Cell surface expression of CA15a and specificity of anti-CA15a. (A) Membrane localization and oligomeric nature of zebrafish CA15a synthesized in cultured cells. 293T cells were transfected with mock, TuCA15-FLAG, or TlCA15-FLAG (Tu for Tuebingen wildtype line and Tl for Tupfel long fin wildtype line, which exhibited a slight variation in their amino acid sequences as mentioned in Section “Materials and Methods”. Two days after transfection, the cells were fractionated into the cytosol (S) and membrane pellets (P). The fractions (25 ¼g of proteins) were analyzed by Western blotting with antibodies against FLAG (top panel), calnexin (an ER membrane marker protein; middle panel), and Drp1 (a member of the dynamin family of large GTPases; bottom panel). (B) Antibody specificity. 293T cells were transiently transfected with mock (lanes 1 and 4), TuCA15-FLAG (lanes 2 and 5), or TlCA15-FLAG (lanes 3 and 6). Cells were homogenized in lysis buffer containing 1 M urea and 1 mM dithiothreitol (see Materials and Methods). The lysates were subjected to immunoprecipitation with anti-FLAG antibody beads followed by Western blotting with anti-CA15a antibody (lanes 4-6). The lysates (40 ¼g of proteins) were also analyzed by Western blotting with anti-FLAG antibody (lanes 1-3). Asterisks indicate the bands corresponding to monomer, dimer, and tetramer of CA15-FLAG. (C) TuCA15-FLAG (lane 2) and TlCA15-FLAG (lane 3) were translated in vitro in the presence of [35S]methionine and [35S]cysteine, and were then analyzed by SDS-PAGE followed by autoradiography. (D) Cell surface expression of CA15a demonstrated by immunofluorescence. COS7 cells were transfected with red fluorescent protein (RFP, red) alone (d2) or along with either TlCA15-FLAG (d1) or HLA-FLAG (d3). Non-permeabilized cells were analyzed by immunofluorescence microscopy with anti-FLAG antibody (green). HLA (human leukocyte antigen) or MHC (major histocompatibility complex) is a cell surface molecule. |
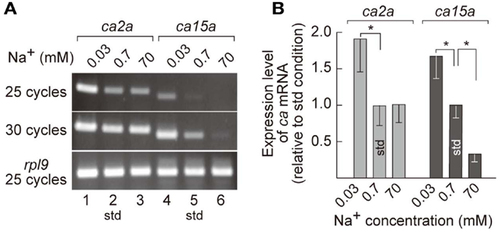
Salinity-dependent expression of ca2a and ca15a in zebrafish larvae. (A) Expression level of ca2a and ca15a in different salinity medium was analyzed by RT-PCR with RNA extracted from 7-dpf larvae reared in 0.0003% (0.03 mM Na+), 0.006% (0.7 mM Na+), or 0.6% (70 mM Na+) salt water. rpl9 (ribosomal protein L9 mRNA) was used as expression control. (B) Levels of ca2a and ca15a mRNA expression estimated by quantitative RT-PCR (qPCR) (n = 4). Data are expressed relative to the value obtained under the standard culture conditions (std; 0.7 mM Na+). *p < 0.05 in the comparison with the standard culture condition (Student’s t-test). EXPRESSION / LABELING:
|
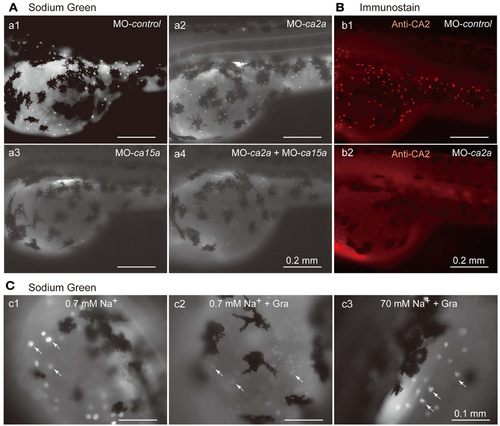
Inhibitory effects of antisense ca2a and ca15a MOs on Na+ accumulation in MRC. (A) Na+ accumulation was analyzed at 55-hpf by monitoring Sodium Green fluorescence (white spots) in a larva injected with 1 ng each of control-MO (a1), ca2a-MO (a2), ca15a-MO (a3), or ca2a-MO plus ca15a-MO (a4). Endogenous fluorescence from the yolk is seen as a weak background. Relatively strong background on the dorsal area of the yolk is due to the formation of swimbladder, which becomes evident at 55–60 hpf. Large and dendritic dark cells are melanocytes. (B) Confirmation of depletion of the CA2a protein in morphants treated with ca2a-MO. Larvae were treated with control-MO (b1) and ca2a-MO (b2) and stained with anti-CA2a antiserum. (C) Sodium Green fluorescence reflecting intracellular concentrations of Na+. Zebrafish larvae were stained with Sodium Green with or without pretreatment with gramicidin (Gra) in the standard culture medium (c1 and c2) and in a high salt medium (c3). Gramicidin was added to equilibrate the intracellular and extracellular Na+ concentrations. PHENOTYPE:
|
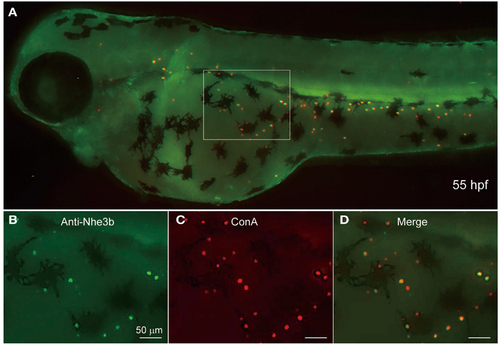
Localization of Nhe3b in H-MRCs of larval skin of zebrafish. (A) A zebrafish larva stained with anti-Nhe3b (green) and ConA (red), a marker for apical membrane of H-MRC. (B-D) Enlarged views of boxed area in (A). Green signals for Nhe3b were relatively weak and therefore enhanced before merging with red signals for ConA. hpf, hours postfertilization. EXPRESSION / LABELING:
|
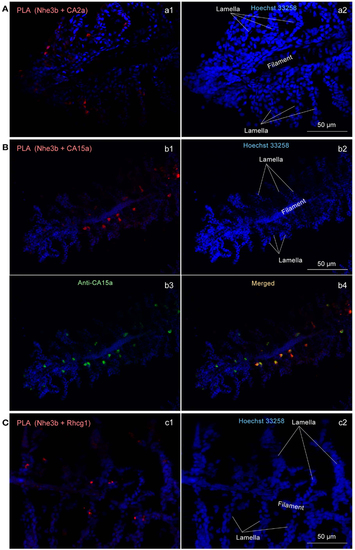
Close association of CA2a, CA15a, Nhe3b, and Rhcg1 visualized by in situ proximity ligation immunoassay (PLA). (A-C) Zebrafish gills were fixed with 4% PFA, incubated with two primary antibodies (a1: rabbit anti-CA2a and rat anti-Nhe3b; b1: rabbit anti-CA15a and rat anti-Nhe3b; and c1: rabbit anti-Rhcg1 and rat anti-Nhe3b), and processed for detecting protein-protein interaction in situ with a Duolink assay kit. Each red signal represents an interaction detected by the kit based on proximity-dependent DNA ligation. (b3) Simultaneous visualization of CA15a by using Alexa Fluor 488-conjugated anti-rat IgG as secondary antibody (green). Blue signals representing nuclei were enhanced in a2, b2, and c2 to show the gill structure. Red PLA signals were enhanced in a1, and b1 but not in c1. EXPRESSION / LABELING:
|
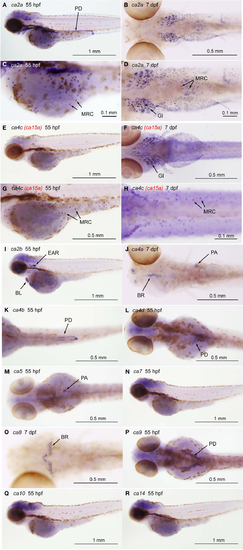
Tissue-specific expression of CA isoforms in zebrafish larvae. Expression of ca genes was analyzed in 55-hpf and 7-dpf larvae by whole mount in situ hybridization with cRNA probes against ca2a [(A,C), lateral views and (B,D), ventral views], ca2b [(I), lateral view], ca4a [(J), dorsal view], ca4b [(K), ventral view], ca4c or ca15a [(C,E), lateral views and (D,F), ventral views], and ca4d [(L), dorsal view], ca5 [(M), dorsal view], ca7 [(N), lateral view], ca8 [(O), dorsal view], ca9 [(P), dorsal view], ca10 [(Q), lateral view], and ca14 [(R), lateral view]. (C,D,G,H) Magnified views of (A,B,E,F), respectively. Tissue- or cell-specific expression of individual ca genes was indicated with arrows in each panel. Abbreviations are gill (GI), mitochondria-rich cell (MRC), blood cell (BL), brain (BR), pronephric ducts (PD), pancreas (PA). We note that broad staining in the brain was non-specific background as it was observed with sense cRNA probes. Four CA4 isoforms predicted from zebrafish database showed different tissue-specific distribution. ca4a, most homologus to mammalian CA IV, is expressed in the pancreas and expected to be involved in the regulation of the luminal pH of the pancreatic duct system (Fujikawa-Adachi et al., 1999). The other two isoforms ca4b and ca4d are expressed respectively in the posterior part and anterior part of the renal pronephric ducts. These expressions reminds that localization of mammalian membrane-bound CA in the proximal tubule cells and the intercalated cells of the collecting ducts, which is suggested to contribute to reabsorption of and regulation of acid-base balance of urine (Dobyan and Bulger, 1982). Its location suggests a role in regenerating CO2, a substrate for CA II. For ca4c (i.e., ca15a), see the text. |