
- Title
-
Ssrp1a controls organogenesis by promoting cell cycle progression and RNA synthesis
- Authors
- Koltowska, K., Apitz, H., Stamataki, D., Hirst, E.M., Verkade, H., Salecker, I., and Ober, E.A.
- Source
- Full text @ Development
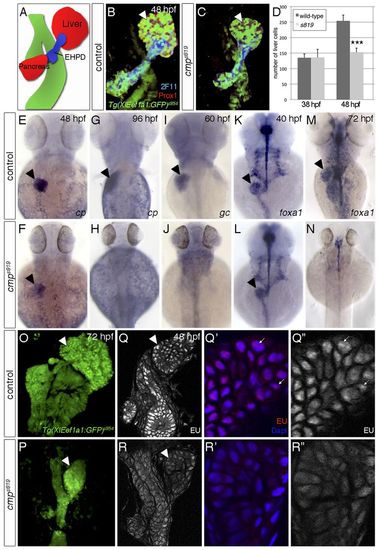
cmps819 controls endodermal differentiation and global transcription. (A) Schematic of endodermal organs. (B,C) Confocal projections of endodermal Tg(XlEef1a1:GFP)s854, hepatic and pancreatic Prox1 and 2F11 in the extrahepatopancreatic ducts (EHPD) show liver and pancreas hypoplasia in cmps819 mutants. (D) Prox1-positive hepatoblasts are significantly reduced in cmps819 embryos at 48 hpf; data show mean±s.e.m., ***P=1.2-5. (E-H) At 48 hpf, cp is expressed in cmps819 livers (E,F), but undetectable at 96 hpf (G,H). (I,J) gc expression is absent in cmps819 embryos at 60 hpf. (K-N) foxa1 is expressed throughout the cmps819 endoderm at 40 hpf (K,L) and is absent at 72 hpf, whereas residual foxa1 is detectable in neural tissues (M,N). (O,P) Tg(XIEef1a1:GFP)s854 labels the digestive system in sibling and cmps819 embryos at 72 hpf. (Q-R3) EU incorporation reveals reduced RNA transcription in the digestive system of cmps819 mutants at 48 hpf. Using the same confocal settings, magnifications of representative sections show fewer EU-positive foci (arrows) in cmps819 livers compared with controls. A-C,O-R3 are ventral views; E-N are dorsal views; all show anterior to the top. Arrowheads indicate liver. |
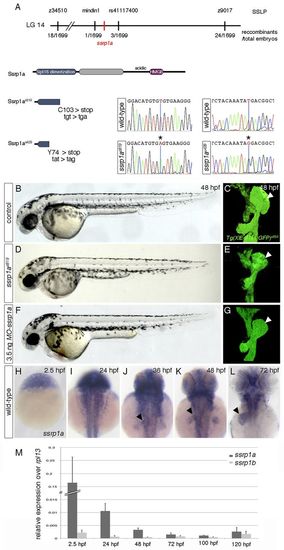
ssrp1a is disrupted in cmp mutants. (A) Genetic map of the cmp-containing region. s819- and u428-lesions in ssrp1a are shown at the nucleotide and protein level. (B-G) MO-ssrp1a-injected embryos (F,G) phenocopy cmps819 defects (D,E). Lateral views show smaller heads and eyes in mutant (D) and MO-ssrp1a embryos (F) compared with controls (B). Confocal projections of Tg(XIEef1a1:GFP)s854 highlight liver (arrowheads) and pancreas hypoplasia in cmps819 (E), and MO-ssrp1a injected embryos (G) compared with controls (C); ventral views, anterior to the top. (H-L) ssrp1a expression in wild-type embryos between 2.5 and 72 hpf. Dorsal views, anterior to the top. After 24 hpf, ssrp1a is enriched in the liver (arrowheads), eyes and fins. (M) qPCR analyses show dynamic ssrp1a and ssrp1b expression levels between 2.5 and 120 hpf. Error bars represent s.d. |
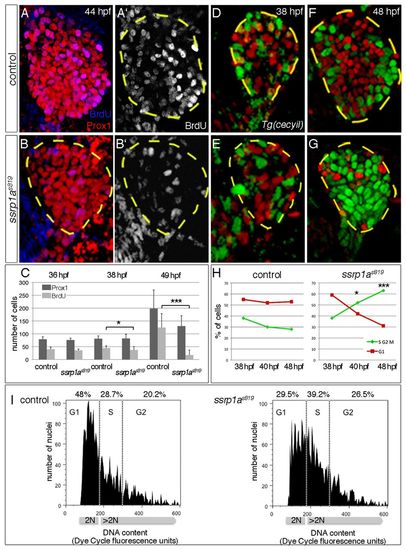
Ssrp1a promotes cell cycle progression. (A-C) BrdU incorporation is reduced in ssrp1as819 mutant livers from 38 hpf onwards (outlined). Error bars represent s.d. (D-G) Transgenic cecyil expression marks G1 phase cells in red and S/G2/M phase cells in green. (H) Quantification of hepatoblast proliferation shows a reversed distribution in controls and ssrp1as819 mutants at 48 hpf. (I) FACS analysis of 42-44 hpf foregut endoderm shows an increase of cells in S phase and a decrease of those in G1 phase in ssrp1as819 mutants. A-B′,D-G are confocal projections of ventral views; all anterior to the top. *P<0.05, ***P<0.0005, determined by unpaired Student’s t-test. |
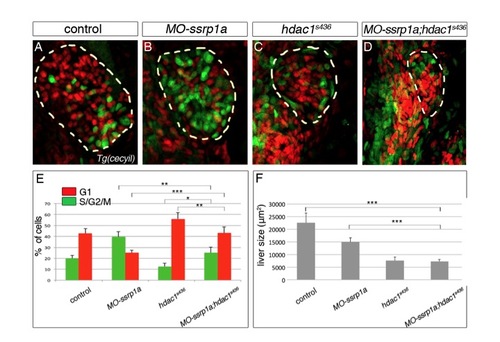
Ssrp1a and Hdac1 are required in different phases of the cell cycle. (A-D) Transgenic cecyil expression marks the cell cycle dynamics in the liver (outlined in yellow; ventral views). Cells in G1 phase are in red and cells in S/G2/M phase in green. (E) Quantification of both populations in MO-ssrp1a and hdac1s436 reveal significant changes compared with controls (G1: MO-ssrp1a, P<0.001, hdac1s436, P<0.001; S/G2/M: MO-ssrp1a, P<0.001, hdac1s436, P<0.05). Enrichment of MO-ssrp1a cells in S/G2/M phase indicate DNA replication defects, whereas enrichment of Hdac1-deficient cells in G1 phase suggest impaired cell cycle progression. MO-ssrp1a;hdac1s436 embryos show a partial rescue of both populations compared with the individual loss-of-function phenotypes. (F) By contrast, liver size does not improve in MO-ssrp1a;hdac1s436embryos compared with MO-ssrp1a, hdac1s436 and control (F). *P<0.05, **P<0.01, ***P<0.001, determined by Student’s t-test. Error bars represent s.e.m. |
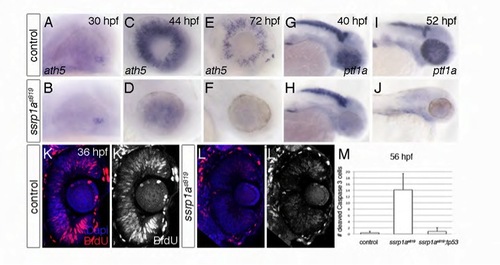
Ssrp1a promotes differentiation and proliferation of the zebrafish eye. (A-F) Retinal ath5 expression in ssrp1as819 mutants is indistinguishable from controls at 30 hpf (A,B), but severely reduced at later stages (C-F). Lateral views, anterior to the right. (K-L′) BrdU incorporation in the eye is severely compromised in mutants compared to wild-type. Coronal sections with anterior to the top. (G-J) ptf1a in differentiating amacrine cells fails to be expressed in ssrp1as819 mutants compared with controls at 40 hpf, whereas expression in the exocrine pancreas and CNS is indistinguishable (G,H). At 52 hpf, ptf1a expression is not detectable in any tissue of ssrp1as819 mutants (I,J). Lateral views, anterior to the right. (M) Genetic depletion of Tp53 significantly rescues cell death in Ssrp1a-deficient cells in the eye. Error bars represent s.d. EXPRESSION / LABELING:
PHENOTYPE:
|
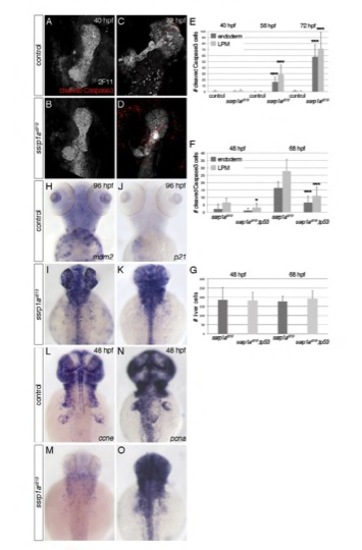
Ssrp1a is required for cell survival. (A-F) Anti-cleaved Caspase-3 staining shows apoptosis in ssrp1as819 mutant livers, co-stained with anti-2F11. Wild-type show no significant apoptosis during liver formation (A,B,E), whereas dying cells are found in ssrp1as819 mutant endoderm and adjacent LPM starting around 48 hpf, and their number is significantly increased from 56 hpf (E). Loss of Tp53 partially rescues apoptosis in ssrp1as819 mutant livers and LPM (F). This indicates that in addition other cell death mechanisms are activated in Ssrp1a-deficient cells. Notably, this rescue is less efficient than in the forming eye (supplementary material Fig. S3M), suggesting tissue-specific responses. (G) Importantly, the overall number of liver cells is not altered in the ssrp1as819;tp53 mutants compared to ssrp1as819 embryos at 48 and 68 hpf. (H-K) At 96 hpf, the expression of Tp53 target genes mdm2 and p21 is strongly increased in ssrp1as819 mutants compared with controls. (L-O) Expression of ccne is already at 48 hpf severely reduced in ssrp1as819 mutants (M), whereas pcna levels are not significantly altered (O). A-D are confocal projections of ventral views, H-O are dorsal views; all anterior to the top. *P<0.05; ***P<0.0005, determined by unpaired Student’s t-test. Error bars represent s.d. |