
- Title
-
Unilateral dampening of bmp activity by nodal generates cardiac left-right asymmetry
- Authors
- Veerkamp, J., Rudolph, F., Cseresnyes, Z., Priller, F., Otten, C., Renz, M., Schaefer, L., and Abdelilah-Seyfried, S.
- Source
- Full text @ Dev. Cell
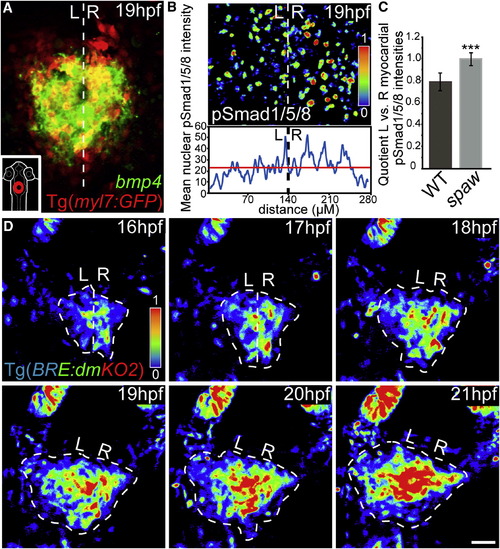
Bmp Signaling Is Weaker within the Left Heart Cone prior to the Appearance of Morphological Asymmetries(A) Fluorescence two-color in situ hybridization of bmp4 expression at the heart cone stage (false-colored image).(B) Cardiac progenitor cells have lower nuclear pSmad-1/5/8 intensities on the left side of the heart as indicated by the color range. The mean intensity plot is a measure of the entire intensities within the field of view.(C) The L/R asymmetry of nuclear pSmad-1/5/8 intensities is abolished in spaw morphant embryos at 19 hpf (mean with SD based on quantifications of eight hearts per genotype; p < 0.0005).(D) The laterality of cardiac jogging coincides with lower intensities of Bmp signaling activity as indicated by the Bmp reporter line Tg[BRE-AAVmlp:dmKO2]mw40 (false-colored image). White dotted line indicates the embryonic midline. Scale bar, 50 μm. L, left; R, right.See also Figures S1, S2, and Movie S1. EXPRESSION / LABELING:
PHENOTYPE:
|
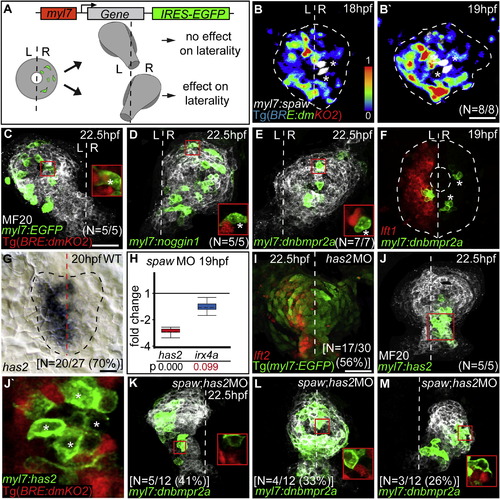
Tissue-Autonomous Inhibition of Bmp Activity Affects Cardiac Laterality(A) Cardiac laterality was assayed at 22.5 hpf in embryos with predominantly right-sided myocardial cell clones at 18 hpf.(B and B′) Spaw-expressing clones (false-colored white, indicated by asterisks) cause reversal of Bmp reporter Tg[BRE-AAVmlp:dmKO2]mw40 relative expression intensities, indicated by color range as shown for 18 hpf (B) and for 19 hpf (B′). Cardiac field is outlined by white dotted circle.(C) Control clones expressing enhanced green fluorescent protein (EGFP) do not affect cardiac jogging. Inset shows expression of the Tg[BRE-AAVmlp:dmKO2]mw40 Bmp reporter in control clone (asterisk) and neighboring cells.(D and E) Misexpression of the Bmp antagonist Noggin1 (D) or of dnBmpr2a (E) on the right side of the cardiac cone causes rightward cardiac jogging. Insets show specific suppression of Bmp activity within EGFP-positive misexpression clones (asterisk).(F) Fluorescence two-color in situ hybridization reveals normal lefty1 cardiac expression in clones expressing dnBmpr2a.(G) L/R asymmetric expression of has2.(H) Whisker box plots indicate relative expression changes of has2 and irx4a based on RT-qPCR analysis of cardiac cDNA (also see Supplemental Experimental Procedures for details on the statistical analysis). Unchanged expression of the cardiac stage marker irx4a shows that observed changes in has2 expression are not due to developmental delay.(I) Fluorescence two-color in situ hybridization of a has2 morphant with loss of cardiac laterality but correct lefty2 expression.(J) Clonal misexpression of Has2 on the right side of the cardiac cone affects cardiac laterality.(J2) Bmp activity is specifically suppressed within EGFP-positive Has2-misexpression clones (asterisks) but not in neighboring WT cells.(K–M) Cardiac laterality in spaw;has2 double morphants that have EGFP-positive dnBmpr2a misexpression clones. Cardiac laterality at 22.5 hpf strictly corresponds to the L/R distribution of dnBmpr2a-expressing cell clones. Shown are examples for mainly left-sided (K), evenly distributed (L), or right-sided (M) dnBmpr2a-expressing cell clones. Insets show that Bmp activity is specifically suppressed within EGFP-positive misexpression clones.L, left; R, right. Dotted line indicates the embryonic midline. Total number of embryos and percentiles indicate the occurrence of the most frequent expression patterns and phenotypes as shown. Scale bars, 50 μm.See also Movie S2. EXPRESSION / LABELING:
PHENOTYPE:
|
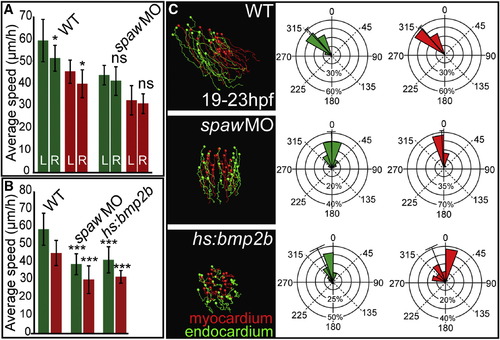
Nodal and Bmp Signaling Affect Cardiac Progenitor Cell Motility and Laterality(A) Quantifications of cell motilities based on time-lapse analyses of endothelial and myocardial reporter lines between 19 and 23 hpf. In WT, endocardial (green) and myocardial (red) progenitor cell motility rates are significantly different between the left and right (mean with SD based on quantifications of at least n = 22 endocardial and n = 30 myocardial cells per genotype; p < 0.025), whereas no significant L/R differences are observed in spaw morphants.(B) Average speed measurements for spaw morphants or Bmp2b-overexpressing endocardial (green) and myocardial (red) progenitor cells reveal highly significant differences compared with WT (mean with SD based on quantifications of at least n = 16 endocardial cells and n = 16 myocardial cells per genotype; p < 0.0005).(C) Myocardial (red) and endocardial (green) progenitor cell tracks based on live imaging. Bearing angles summarize all endocardial and myocardial cell tracks. ns, not significant.See also Movies S3 and S4. EXPRESSION / LABELING:
PHENOTYPE:
|
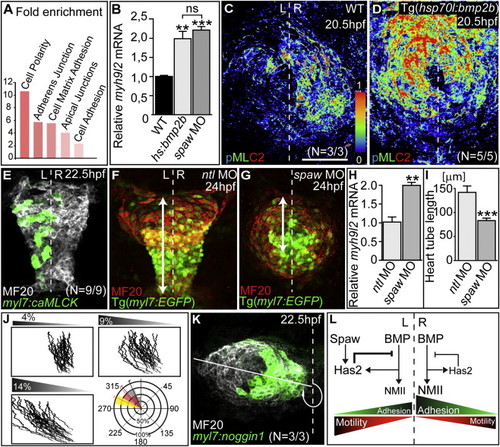
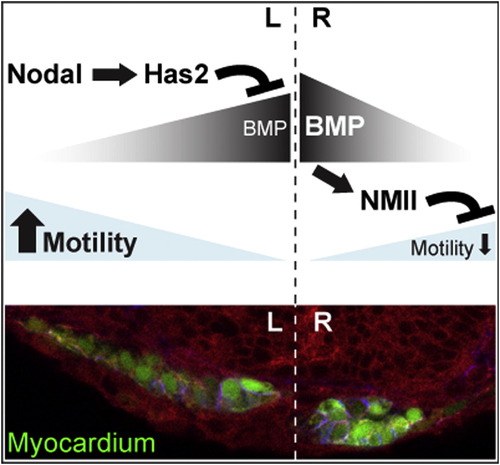
Control of Cardiac Progenitor Cell Motility by Bmp(A) Enrichment analysis of genes upregulated in Tg[hsp70l:bmp2b]fr13 versus WT cardiac tissue at 21.5 hpf according to Database for Annotation, Visualization and Integrated Discovery-based clustering for functional terms.(B) RT-qPCR comparative analysis of relative expression levels of myh9l2 in cardiac tissue-derived cDNAs at 24 hpf (mean values with SEM; p < 0.01; p < 0.0005).(C) Expression of phosphorylated NMII (pMLC2) is slightly higher on the right side of the WT cardiac field.(D) Strong expression of phosphorylated NMII throughout the entire heart cone in Tg[hsp70l:bmp2b]fr13 transgenic embryos heat shocked at 18 hpf.(E) Clonal misexpression of caMLCK on the left side of the cardiac cone affects cardiac laterality.(F and G) Loss of Ntl (F) and Spaw (G) abolishes cardiac laterality, but heart tube elongation is most strongly affected in spaw morphants. Heart tube length is the extension between the outflow tract region and leading edge of the atrium (arrows).(H) RT-qPCR comparative analysis of relative expression levels of myh9l2 in spaw and ntl morphant hearts at 24 hpf (mean values with SEM; p < 0.005).(I) Heart tube length in spaw and ntl morphants at 24 hpf (mean values with SEM; p < 0.0005).(J) Simulations of cardiac jogging based on a random cell motility model. Three representative simulations covering a range of L/R differences in cell motility and the respective bearing angles based on ten independent simulations for each condition are shown. The 9% condition of L/R motility differences most closely resembles WT cardiac jogging (red bearing angle).(K) Clonal misexpression of the Bmp antagonist Noggin1 within the left myocardium enhances the angle of cardiac jogging toward the left.(L) Model of Nodal-Bmp pathway interactions during stages of cardiac jogging.Total numbers of embryos indicate the occurrence of the most common phenotypes as shown. L, left; R, right; ns, not significant (for details on statistical analysis, see also Supplemental Experimental Procedures). Scale bars, 50 μm.See also Figures S3 and S4. EXPRESSION / LABELING:
PHENOTYPE:
|
|
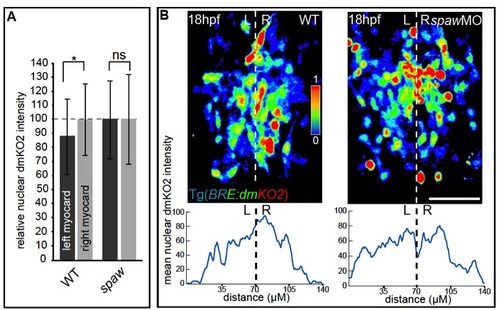
L/R asymmetry of Bmp signaling within the heart requires Nodal activity. (A) Quantification of L/R asymmetry of nuclear dmKO2 intensity levels, which is significant in WT, but is abolished in spaw morphant embryos at 18 hpf (mean with s.d. based on quantifications of three hearts per genotype; p<0.05, *). (B) Dorsal view onto cardiac field in Tg[BREAAVmlp: dmKO2]mw40 transgenic embryos, which indicates symmetrical Smad-1/5/8-mediated activities in spaw morphant hearts at 18 hpf. Signaling intensities are indicated by color range. Shown is one of three embryos analyzed per genotype. Mean intensity plots are a measure of the entire intensities within the field of view. Scale bar is 50μm. L, left; R, right; ns, not significant. |
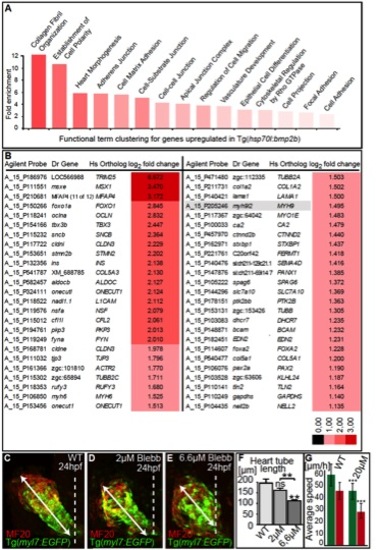
Transcriptome analysis of cardiac gene expression upon Bmp up-regulation. (A) Enrichment analysis of genes up-regulated in Tg[hsp70l:bmp2b]fr13 versus WT cardiac tissue at 21.5 hpf according to Database for Annotation, Visualization and Integrated Discovery (DAVID) based clustering for functional terms (Huang et al., 2009). (B) Partial list of up-regulated cardiac genes in Tg[hsp70l:bmp2b]fr13 embryos heat-shocked at 18 hpf compared with WT. Non-muscle myosin II heavy chain subunit is marked in grey. (C-E) Unlike DMSO-treated control embryos, inhibition of NMII with Blebbistatin reduces heart tube elongation (arrows) in a dose-dependent manner. (F) Treatment with 2μM Blebbistatin has no significant (ns) effect on heart tube elongation, whereas 6.6μM Blebbistatin-treated hearts are significantly shortened at 24hpf (mean values with S.E.M.; p<0,005, **). (G) Comparison of average speed measurements for 20μM Blebbistatin-treated endocardial (green) and myocardial progenitor cells (red) reveal highly significant differences compared with WT (mean with s.d. based on quantifications of at least n=16 endocardial cells and n=16 myocardial cells per genotype; p<0.0005, ***). |
Reprinted from Developmental Cell, 24(6), Veerkamp, J., Rudolph, F., Cseresnyes, Z., Priller, F., Otten, C., Renz, M., Schaefer, L., and Abdelilah-Seyfried, S., Unilateral dampening of bmp activity by nodal generates cardiac left-right asymmetry, 660-667, Copyright (2013) with permission from Elsevier. Full text @ Dev. Cell