
- Title
-
Autophagy induction is a tor- and tp53-independent cell survival response in a zebrafish model of disrupted ribosome biogenesis
- Authors
- Boglev, Y., Badrock, A.P., Trotter, A.J., Du, Q., Richardson, E.J., Parslow, A.C., Markmiller, S.J., Hall, N.E., de Jong-Curtain, T.A., Ng, A.Y., Verkade, H., Ober, E.A., Field, H.A., Shin, D., Shin, C.H., Hannan, K.M., Hannan, R.D., Pearson, R.B., Kim, S.H., Ess, K.C., Lieschke, G.J., Stainier, D.Y., and Heath, J.K.
- Source
- Full text @ PLoS Genet.
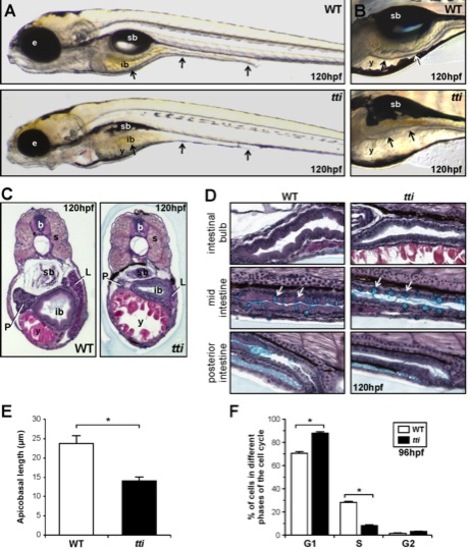
(A, B) Differential interference contrast (DIC) images of WT and ttis450 larvae at 120 hpf. (A) The black arrows indicate, from left to right, the 3 regions of the intestine: the intestinal bulb, mid-intestine and posterior intestine. (B) The intestinal epithelium in WT larvae is extensively folded (upper panel) and is thinner and unfolded in ttis450 larvae (bottom panel). In ttis450, yolk resorption is incomplete and the swim bladder does not inflate. Microphthalmia is evident and the head is slightly smaller and misshapen. (C, D) Transverse (C) and sagittal (D) histological sections of WT and ttis450 larvae at 120 hpf stained with alcian blue periodic acid-Schiff reagent. The anterior part of the intestine (intestinal bulb) is expanded and the epithelium is elaborated into folds in WT larvae (C, left panel). In ttis450 the intestinal bulb, liver and pancreas are smaller than in WT and the epithelium is relatively thin and flat (C, right panel). (D) The intestinal epithelial cells of the entire intestinal tract are columnar in shape in WT larvae (left panels) and are cuboidal in ttis450 (right panels). Goblet cells containing acidic mucins (turquoise staining) are present in approximately equal numbers (white arrows) in the WT and ttis450 mid-intestine. sb, swim bladder; b, brain; ib, intestinal bulb; y, yolk; e, eye; s, somite; P, pancreas; L, liver; (E) The average apicobasal length of the IECs in the intestinal bulb region of ttis450 larvae at 120 hpf is approximately half that of WT IECs. Measurements were performed on 10 cells in 3 independent sections. (F) Fluorescent activated cell sorting analysis of the cell cycle in cells derived from the GFP-positive, endoderm derived organs (liver, pancreas, intestine) of ttis450 and WT larvae on the gutGFP background at 96 hpf. Data are represented as the mean +/ SD (n = 3), *p<0.05. |
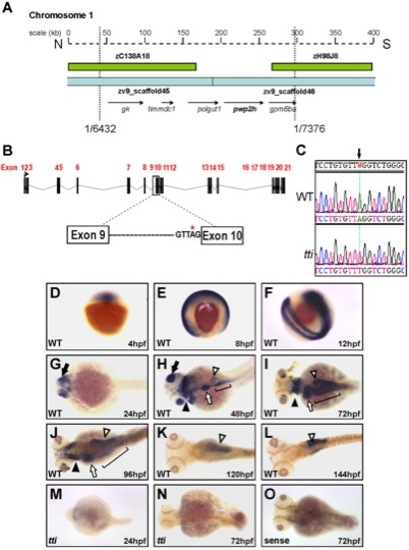
(A) Physical map of chromosome 1 in the region encompassing the ttis450 locus. Analysis of recombinants from 7376 meioses narrowed the genetic interval containing the mutation to a region flanked by 2 BACs (green boxes) and encompassed by 2 scaffolds zv945445 and zv945446 (blue bars) containing 5 genes (arrows). (B) Schematic representation of the pwp2h gene and the location of the sequence variation in intron 9. (C) The nucleotide sequence of pwp2h cDNA from ttis450 larvae contains an A→T transversion. Wholemount in situ hybridization (WISH) reveals the pwp2h mRNA expression pattern from 4–144 hpf in WT larvae (D–L). pwp2h expression is ubiquitous from 4–12 hpf (D–F), restricted to the retina at 24 hpf (G; black arrow) and encompasses the pharyngeal cartilages (black arrowhead), liver (white arrow), intestine (bracket) and pancreas (white arrowhead) at 48 hpf (H), 72 hpf (I) and 96 hpf (J). From 120–144 hpf pwp2h expression is restricted to the pancreas (K–L; white arrowhead). pwp2h expression is barely detectable at 24 hpf (M) and 72 hpf (N) in ttis450 larvae. Staining is absent in the sense control at 72 hpf (O) and at all other time points (data not shown). |
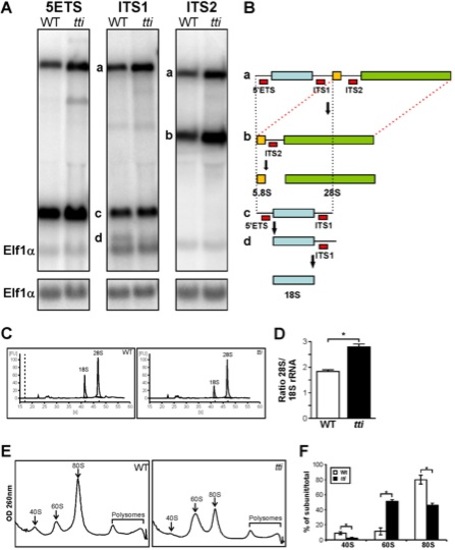
(A) Northern analysis of RNA isolated from WT and ttis450 larvae at 120 hpf using 5′ETS, ITS1, and ITS2 probes to detect precursor forms of rRNA. Elf1α is a loading control. a-d correspond to the rRNA intermediates depicted in Figure 3B. (B) Schematic diagram showing the rRNA processing pathway in zebrafish [60]. The sites of hybridization of the 5′ETS, ITS1 and ITS2 probes are indicated. (C) Representative E-Bioanalyser analysis of total RNA isolated from WT and ttis450 larvae at 120 hpf demonstrates a reduction in the 18S peak in ttis450 larvae resulting in an elevated 28S/18S rRNA ratio in ttis450 (D). Graphical representation of the experiment shown in C. Data are represented as mean +/ SD (n = 5). (E) Representative polysome fractionation analysis performed on WT and ttis450 larvae at 96 hpf demonstrates reduced levels of 40S ribosomal subunits and 80S monosomes and an increase in free 60S subunits in ttis450 larvae compared to WT. (F) Graphical representation of the experiment shown in E. Data are represented as mean +/ SD (n = 5) *p<0.05. |
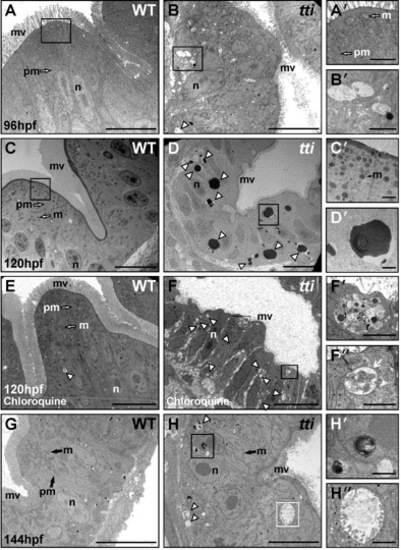
(A–H) Transmission electron micrographs of WT and ttis450 larvae at 96 hpf (A, B), 120 hpf (C–F) and 144 hpf (G, H). Sections are transverse through the yolk in the region of the intestinal bulb. WT IECs demonstrate well-developed apicobasal polarity as evidenced by basally positioned nuclei (n) and the elaboration of microvilli (mv) projecting from the apical surface into the intestinal lumen. Mitochondria (m) are abundant and plasma membranes (pm) are well defined. The intestinal epithelium in ttis450 is highly disorganized, with shorter and relatively sparse apical microvilli compared to WT. Vesicles resembling autophagosomes (white arrowhead in B) are present in the intestinal epithelial cells of ttis450 larvae (B′ [boxed area in B], H′′ [boxed area in H]) but not in WT (A, A2 [boxed area in A] and G). At 120 hpf, electron-dense structures, likely to correspond to autolysosomes, are present in ttis450 larvae (white arrowheads in D, D′ [boxed area in D]), but not WT (C, C′ [boxed area in C]). When ttis450 larvae are treated with chloroquine to block the fusion of autophagosomes with lysosomes, the electron-dense structures are no longer apparent at 120 hpf; instead vesicles more typical of autophagosomes are found (white arrowheads in F). The boxed areas in F (F′ and F′′) show vesicles containing debris, including one (white arrow in F′′), with a clear double membrane. Scale bars = 10 μm (A–H) and 1 μm (all insets). |
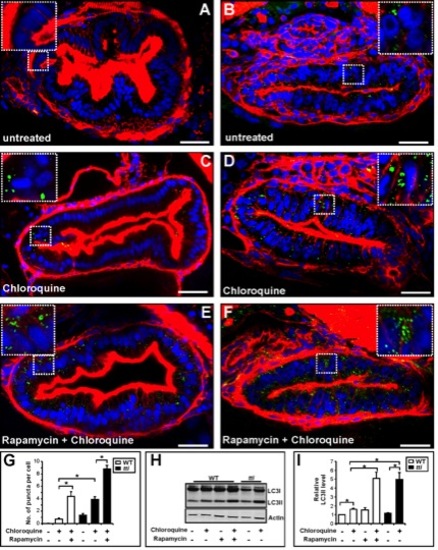
(A–F) Transverse sections (200 μm) through the intestinal bulb region of untreated WT (A) and ttis450 (B) larvae at 120 hpf or larvae previously treated for 14 h with rapamycin and/or chloroquine (C–F) stained with rhodamine phalloidin to detect F-actin (red), Hoechst 33342 to detect DNA (blue) and the LC3B antibody to detect LC3II–containing autophagosomes (green puncta). (G) The numbers of autophagosomes are increased in chloroquine-treated WT and ttis450 larvae compared to the corresponding untreated larvae. Chloroquine-treated ttis450 larvae contain significantly more puncta than chloroquine-treated WT larvae and similar numbers to WT larvae treated with rapamycin and chloroquine. Rapamycin and chloroquine-treated ttis450 larvae contain significantly more puncta per IEC than the IECs in chloroquine-treated ttis450 larvae and chloroquine and rapamycin-treated WT larvae. Puncta were counted in 20 cells from 3 independent sections using Metamorph. (H) Representative Western blot analysis of whole cell lysates of WT and ttis450 larvae (96 hpf) previously treated for 14 h with rapamycin (10 μM) and/or chloroquine (2.5 μM) using antibodies to LC3B and Actin (loading control). (I) Graphical representation of the data shown in H and two independent analyses. The LC3II signals were quantitated by densitometry. ttis450 larvae treated with chloroquine contain more LC3II than their chloroquine-treated WT siblings and comparable levels to WT larvae treated with rapamycin and chloroquine. Data are represented as mean +/ SD, *p<0.05. |
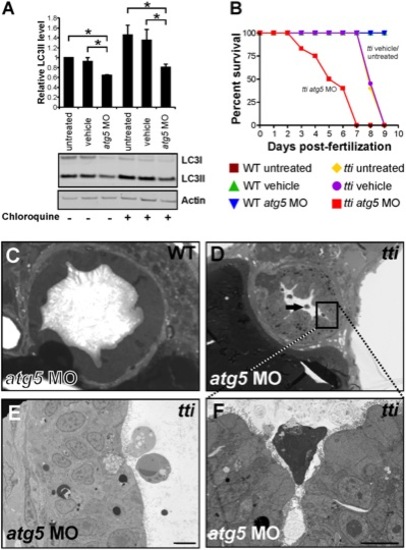
(A) Western blot analysis of lysates of ttis450 larvae (72 hpf) that had been injected at the 1–4 cell stage with an antisense morpholino oligonucleotide (MO) targeted to the start codon of atg5 mRNA reveals decreased levels of LC3II compared to untreated and vehicle controls, both in the presence and absence of chloroquine. Data are represented as mean +/ SD, *p<0.05. (B) Survival curve of untreated WT and ttis450 larvae compared to WT and ttis450 larvae that had been injected at the 1–4 cell stage with vehicle or atg5 MO (n>85 larvae per group). The lifespan of WT embryos/larvae is completely unaffected by injection with the atg5 MO since all three groups of WT larvae (untreated, vehicle-treated and atg5 MO-treated) progress normally through the first 10 days of development, when the experiment was terminated. The horizontal line represents untreated WT embryos (maroon squares), vehicle-injected WT embryos (green triangles) and atg5 MO-injected WT embryos (blue triangles). In contrast, ttis450 embryos respond to microinjection of the atg5 MO by impaired survival. Whereas all untreated (yellow diamonds) or vehicle-injected (purple circles) ttis450 larvae are still alive at 7 dpf, all the atg5 MO-injected ttis450 larvae are dead at this time-point (red squares). Indeed, 20% of the atg5 MO-injected ttis450 larvae have already succumbed by 3 dpf. (C–F) TEMs of WT (C) and ttis450 larvae at 120 hpf (D–F), injected at the 1–4 cell stage with the atg5-targeted MO. Inhibiting autophagy in ttis450 larvae results in the appearance of detached and shrunken IECs in the intestinal lumen (black arrow in D, E and F [boxed area in D]) but has no impact on WT IECs (C). Scale bars = 10 μm. EXPRESSION / LABELING:
|
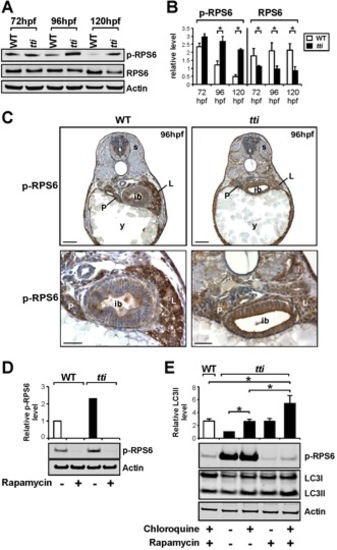
(A) Western blot analysis of RPS6, p-RPS6 and Actin (loading control) in whole cell lysates of WT and ttis450 larvae between 72–120 hpf. (B) Graphical representation of the data shown in A combined with two additional experiments (each bar represents the mean +/ SD, *p<0.05). ttis450 larvae exhibit increased levels of p-RPS6 at 96–120 hpf and decreased levels of total RPS6 between 72–120 hpf compared to WT siblings. (C) Immunohistochemical analysis of transverse sections of ttis450 and WT larvae at 96 hpf reveals robust p-RPS6 expression in the digestive organs. Scale bars = 50 μM. (D) The persistent expression of p-RPS6 expression in ttis450 larvae at 96 hpf compared to WT is due entirely to up-regulated Torc1 activity as shown by the disappearance of the p-RPS6 signal when larvae are pre-treated with rapamycin. (E) Inhibiting the Tor pathway in ttis450 larvae with rapamycin in the presence of chloroquine reduces p-RPS6 expression and at the same time increases autophagic flux as shown by the increase in LC3II level. In the graphical representation of the data, each bar represents the mean +/ SD (n = 3), *p<0.05. EXPRESSION / LABELING:
|

(A) Western blot analysis of Tp53 protein in whole cell lysates of WT (lane 1) and ttis450 (lane 2) larvae at 96 hpf reveals up-regulation of Tp53 expression in ttis450. Larvae treated with roscovotine (ROS; lane 3) to induce Tp53 protein expression or untreated larvae (lane 4) are positive and negative controls, respectively. The Actin signal provides a loading control. (B–E) Relative expression of ΔN113p53 (B), mdm2 (C), cyclinG1 (D) and p21 (E) mRNAs in WT, ttis450 (pwp2h-/-), tp53M214K/M214K (tp53-/-) and ttis450;tp53M214K/M214K (pwp2h-/-;tp53-/-) larvae at 96 hpf (n = 3) demonstrates that the expression of Tp53 target genes is increased in ttis450 compared to WT larvae (compare first 2 bars in all graphs). The Tp53 response is diminished on the tp53M214K/M214K background, as expected (compare 2nd and 4th bars). Data were normalised by reference to Elongation factor alpha (Elf-α) expression. (F) Western blot analysis of LC3 in whole cell lysates of tp53-mutant (tp53M214K/M214K) and ttis450;tp53M214K/M214K larvae at 96 hpf. The elevated autophagic flux in ttis450 larvae due to ribosomal stress is not diminished on a tp53-mutant background. (G) Graphical representation of the data shown in F and two additional experiments. Bars represent the mean +/- SD (n = 3), *p<0.05. (H) Transmission electron micrographs of IECs of ttis450;tp53M214K/M214K larvae at 120 hpf (right panel) reveal electron dense vesicles, resembling autolysosomes (white arrowhead), in comparable numbers to those found in ttis450 larvae with WT Tp53 expression (left panel). |
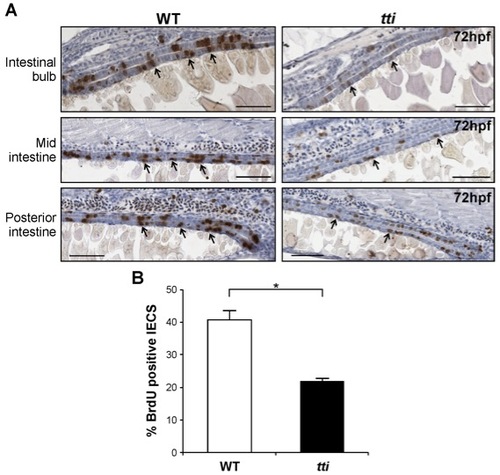
ttis450 larvae contain fewer replicating IECs than WT larvae. (A) Sagittal sections of the intestine of WT and ttis450 zebrafish larvae at 72 hpf showing cells that accumulated BrdU (black arrows) during a 30 min exposure to this thymidine analogue at 72 hpf. BrdU-positive nuclei (brown) indicate cells in the S-phase of the cell cycle. Scale bars = 50 μm. (B) Quantitation of BrdU-positive IECs in three independent sagittal sections of WT and ttis450 larvae at 72 hpf reveals that ttis450 larvae contain approximately 50% fewer S-phase IECs than WT. *p<0.05. Data are represented as mean +/ SD. |
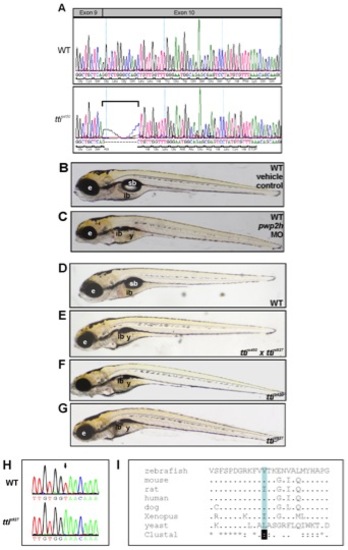
pwp2h is the mutated gene in ttis450. (A) Sequence of pwp2h in WT and ttis450 cDNA reveals that ttis450 larvae utilize a cryptic splice site in exon 10 due to a mutation in the splice acceptor site in intron 9. This results in an 11 bp deletion (bracket) which causes a frame-shift in the pwp2h coding sequence resulting in 13 aberrant amino acids and a premature stop codon in exon 10. (B, C) Upon microinjection into the yolk of 1–4 cell WT zebrafish embryos, a pwp2h-targeted MO (15 ng) produces a robust ttis450 phenotype at 120 hpf (C). Vehicle-injected controls appear WT (B). (D–G) Non-complementation of 2 independent pwph2 alleles confirms that pwph2 is the mutated gene in ttis450. Heterozygous ttis450 carriers were crossed with heterozygous carriers of s927, an independent pwph2 allele identified in the 2-CLIP screen [30]. One quarter of the offspring are compound ttis450;ttis927 mutants (E) and exhibit the ttis450 phenotype (F) at 120 hpf including impaired development of the digestive organs, eye and craniofacial structures. Other panels show WT (D) and ttis927 mutant (G) larvae at 120 hpf. These data indicate that both alleles correspond to the same genetic locus. e, eye; ib, intestinal bulb; sb, swim bladder; y, yolk. (H) The nucleotide sequence of pwp2h cDNA generated from ttis927 larvae contains a T→A transversion (arrow). (I) The base change in ttis927 results in a highly conserved branched amino acid (valine, shaded blue) being replaced by glutamic acid. Alignment was performed using ClustalW. PHENOTYPE:
|
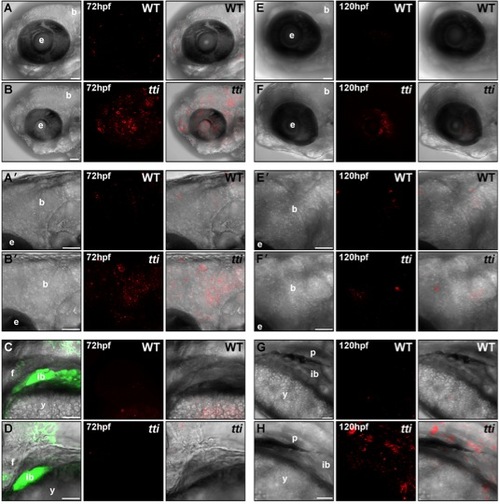
LC3II-containing autophagosomes are found in multiple tissues in ttis450 larvae at 72 hpf and 120 hpf. (A–H) RNA encoding a mCherry-LC3 fusion protein was injected into the yolk of 1–4 cell zebrafish embryos derived from a pairwise mating of ttis450/+ heterozygotes (on the gutGFP background) and allowed to develop until the indicated time-point in the presence of chloroquine for the final 14 h. Maximum intensity projection images of a z series of confocal sections through WT [A, A′ (boxed area in A), C, E, E′ (boxed area in E) and G] and ttis450 larvae [B, B′ (boxed area in B), D, F, F′ (boxed area in F) and H] showing accumulated autophagosomes (red puncta) in the brain, eye and digestive organs (marked by GFP fluorescence in C, D) at 72 hpf (A–D) and 120 hpf (E–H). Scale bars = 50 μM. b, brain; e, eye; ib, intestinal bulb; f, fin; y, yolk; p, pancreas. |
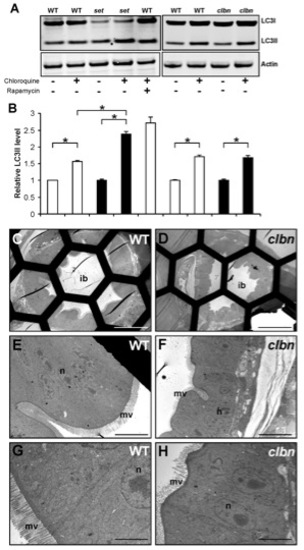
Up-regulated autophagy is not a shared feature of all zebrafish intestinal mutants. (A) Western blot analysis of LC3 in protein extracts of WT, setebos (sets453) and caliban (clbns846) larvae. Actin was used as a loading control. (B) The levels of LC3II were quantitated by densitometric analysis of three independent Western blots. Chloroquine-treated sets453 larvae at 96 hpf contain significantly higher LC3II levels compared to their chloroquine-treated WT siblings; meanwhile, LC3II levels are similar in chloroquine-treated sets453 larvae and WT larvae treated with rapamycin and chloroquine. There are no significant differences between LC3II levels in clbns846 larvae and their WT siblings at 120 hpf, in the presence and absence of chloroquine. Data are represented as mean +/ SD (n = 3), *p<0.05. (C–H) Transmission electron micrographs of transverse sections of WT (C, E, G) and clbns846 larvae (D, F, H) through the intestinal bulb region at 120 hpf. There are negligible numbers of autophagosomes/autolysosomes in the IECs of WT and clbns846 larvae. Scale bars = 50 μm (C, D); 10 μm (E, F); 5 μm (G–H). ib, intestinal bulb; n, nucleus; m, mitochondria; mv, microvilli. |
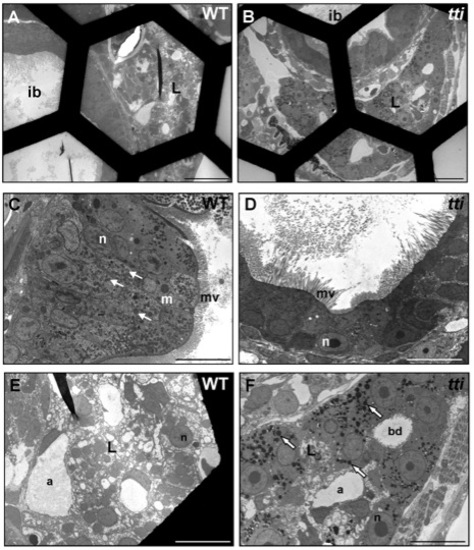
Absence of dead cells in the intestinal lumen of WT and ttis450 larvae at 7 dpf. (A–F) Transmission electron micrographs of transverse sections of WT and ttis450 larvae at 168 hpf (7 dpf). The number of conspicuous autophagosome-like structures in the IECs of ttis450 larvae has diminished by 7 dpf and there are no dead cells in the lumen (D). Meanwhile, liver cells of ttis450 larvae contain abundant autolysosome-like structures at this time-point (F, white arrows). Scale bars = 50 μm (A, B); 10 µm (C–F). ib, intestinal bulb; n, nucleus; m, mitochondria; mv, microvilli; l, liver; bd, bile duct; a, arteriole. |
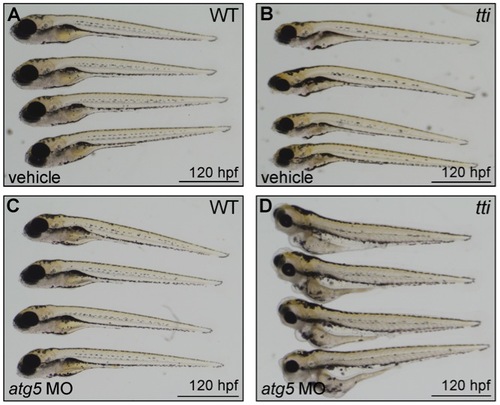
Disruption of autophagy in ttis450 larvae results in severe oedema. Upon microinjection into the yolk of 1–4 cell WT and ttis450 zebrafish embryos, an atg5-targeted MO (1 ng) produces severe oedema around the organs of ttis450 larvae at 120 hpf (D), while WT larvae are unaffected (C). WT and ttis450 larvae injected at the 1–4 cell stage with vehicle (A, B) are also unaffected. PHENOTYPE:
|
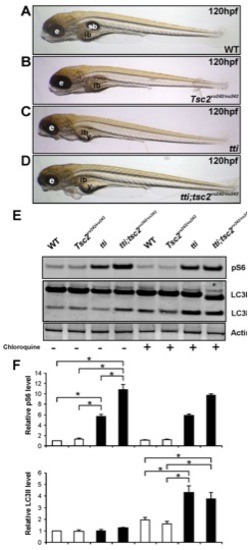
Autophagic flux in ttis450 larvae is not abrogated by Tor pathway activation. (A–D) Enhancing Torc1 activity by ablating Tsc2 activity in ttis450 larvae does not change their gross morphology at 120 hpf. Compound mutants (ttis450;Tsc2vu242/vu242) (D) are essentially indistinguishable from ttis450 larvae (C). Other panels show WT (A) and Tsc2vu242/vu242 mutant (B) larvae. (E,F) Western blot analysis of p-RPS6 and LC3 demonstrates that ttis450;Tsc2vu242/vu242 compound mutants at 96 hpf contain higher levels of p-RPS6 than ttis450 mutants due to increased Tor activity, yet LC3II levels are comparable between the two genotypes (refer to right hand half of the Western blot, where the larvae were pre-treated with chloroquine). p-RPS6 and LC3II levels are not significantly different between WT and tsc2vu242/vu242 larvae in the presence of chloroquine. Actin was used as a loading control. The levels of LC3II were quantitated by densitometric analysis of three independent Western blots. Data are represented as mean +/ SD, *p<0.05. |

Unillustrated author statements PHENOTYPE:
|