
- Title
-
The zebrafish mutants for the V-ATPase subunits d, ac45, E, H and c and their variable pigment dilution phenotype
- Authors
- Ramos-Balderas, J.L., Carrillo-Rosas, S., Guzman, A., Navarro, R.E., and Maldonado, E.
- Source
- Full text @ BMC Res. Notes
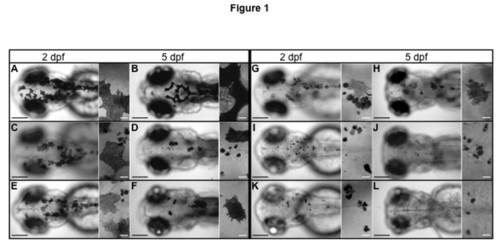
Dorsal views from five insertional zebrafish mutants in V-ATPase subunits. The fish larvae are shown at 2 dpf (A, C, E, G, I and K) and at 5 dpf (B, D, F, H, J and L). For each image a close up view is at the right side. Wild type larvae are in (A and B) and show normal pigmentation. Pigment dilution is observed in all V-ATPase mutants (C – L), however the severity of the pigment phenotype was mild in V0-d1 (gene atp6vod1) (C and D) and V0-ac45b (gene atp6ap1b) (E and F). It was more severe in V1-E1b (gene atp6v1e1b) (G and H) and V1-H (gene atp6v1h) (I and J), but even more severe in V0-ca (gene atp6v0ca) (K and L). In all the mutants there are a combination of pale melanocytes and dark melanin spots considered to be fragments of cells. Pale melanocytes became scarce the more severe the phenotype was (compare C and I). Bars in low amplification views are 200 μm and bars in close ups are 20 μm. |
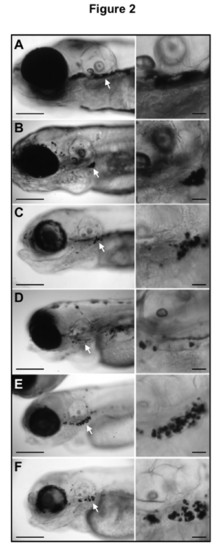
Lateral views from zebrafish insertional mutants for five V-ATPase subunits. Larvae WT (A) and mutants in subunits V0-d1 (B), V0-ac45b (C), V1-E1b (D), V1-H (E) and V0-ca (F) are shown. To the right from every image there is a close up view of the region indicated by the white arrow in the left panel. Melanin round spots accumulate ventrolateral to the ear, which is an identical feature observed in the class VI.C of zebrafish mutants from the Tubingen chemical screening (see reference 38). Even though the reason for this phenotypic characteristic is unknown, it could be used as a form to identify this type of mutations. PHENOTYPE:
|
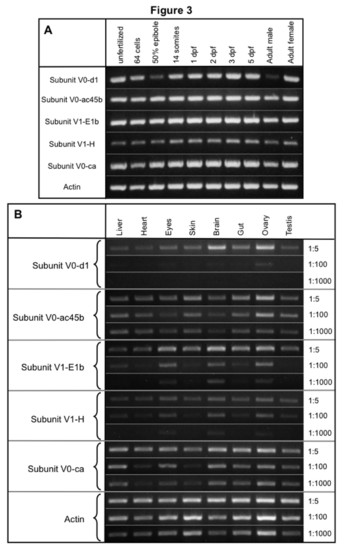
RT-PCR of the five V-ATPase subunits in embryos at different developmental stages and in organs from adult fish. (A) RT-PCR from WT embryos at different developmental stages using oligonucleotides that amplify five different V-ATPase subunits. All subunits are consistently expressed throughout all developmental stages, however subunit V1-H is expressed in lower amounts than V0-d1, V0-ac45b, V1-E1b, V1-H and V0-ca. Alpha actin expression was used as an expression control. V0-d1 is abundant in adult males than in females. (B) Semi-quantitative RT-PCR from total RNA obtained from liver, heart, eyes, skin, brain, gut, ovaries and testis from adult zebrafish. The cDNA used was diluted 1:5, 1:100 and 1:1000 and then used for the RT-PCR. V-ATPase subunits V0-ca and V0-ac45b have the higher expression levels, in contrast V0-d1 have the lower expression levels. V1-E1b and V1-H have similar expression; both are enriched in the eyes, brain and ovary. |
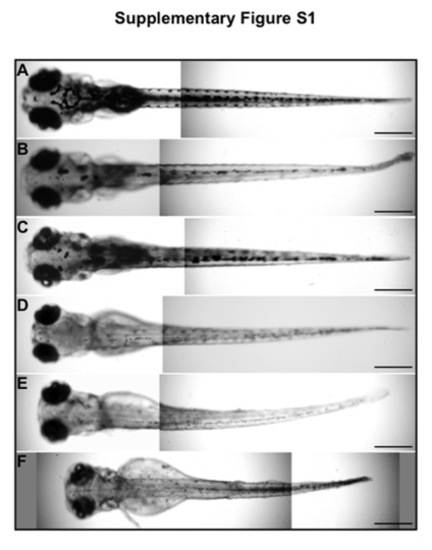
Developmental delay and body size reduction in V-ATPase mutants. Dorsal views of the whole body from zebrafish WT (A) and five different V-ATPase mutants (B – F) at 5 dpf. A consequence of developmental delay is that by 5 dpf the mutant larvae have not reached is full size. Zebrafish mutants for subunits V0-d1 and V0-ac45 were of the same size as WT fish (A – B), while V1-E1b and V1-H mutants have a slight reduction in body size (D and E). V0-ca mutant is the most affected of all and its size is much more reduced. Bar is 400 μm. |
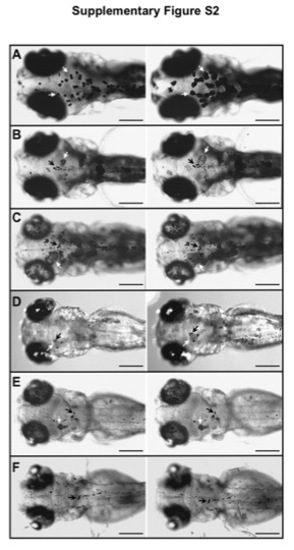
Dark adaptation experiment in V-ATPase zebrafish mutants. Background adaptation was used as a qualitative assay to compare the physiological state of V-ATPase mutants at 5 dpf. (A) WT, (B) V0-d1, (C) V0-ac45b, (D) V1-E1b, (E) V1-H and (F) V0-ca. Larvae at the right panels are the same fish than the left panels, after 2 h of dark adaptation. Whereas WT, V1-d and V0-ac45b larvae (A – C) show a positive response by expanding melanocytes in the dark background, V1-E1b, V1-H and V0-ca fail to show any response. White arrows point at the same melanocyte cell before and after dark adaptation. In mutant fish there are as well spots of melanin that we consider fragments of cells (black arrows) these spots do not expand after the dark adaptation treatment. Because of the pigment dilution phenotype in V-ATPase mutants, melanocytes are paler than WT melanocytes. Images from before and after dark adaptation were taken under the same light conditions. Bar is 200 μm. |